

Question: Based on the following chart, what is the expected return and standard deviation of this portfolio: begin{tabular}{|l|l|l|} hline & Probabllity & HPR hline Recession
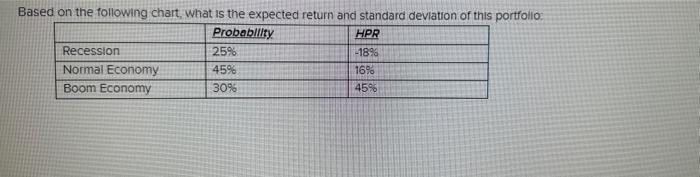
Based on the following chart, what is the expected return and standard deviation of this portfolio: \begin{tabular}{|l|l|l|} \hline & Probabllity & HPR \\ \hline Recession & 25% & 18% \\ \hline Normal Economy & 45% & 16% \\ \hline Boom Economy & 30% & 45% \\ \hline \end{tabular}
Step by Step Solution
There are 3 Steps involved in it
1 Expert Approved Answer
Step: 1 Unlock

Question Has Been Solved by an Expert!
Get step-by-step solutions from verified subject matter experts
Step: 2 Unlock
Step: 3 Unlock