

Question: Based on the following data and using the EXCEL program, build the graph of In Pvapor as a function of 1/T and determine the evaporation
Based on the following data and using the EXCEL program, build the graph of In Pvapor as a function of 1/T and determine the evaporation AH of the examined liquid.
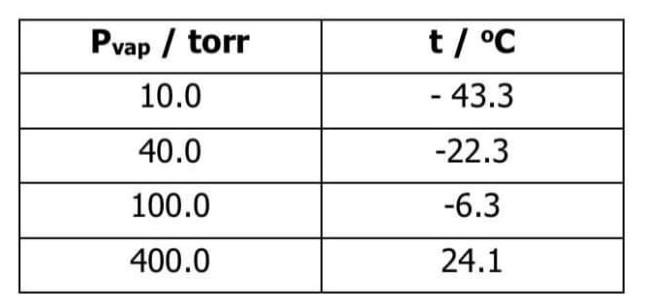
\begin{tabular}{|c|c|} \hline Pvap/ torr & t/C \\ \hline 10.0 & -43.3 \\ \hline 40.0 & -22.3 \\ \hline 100.0 & -6.3 \\ \hline 400.0 & 24.1 \\ \hline \end{tabular} \begin{tabular}{|c|c|} \hline Pvap/ torr & t/C \\ \hline 10.0 & -43.3 \\ \hline 40.0 & -22.3 \\ \hline 100.0 & -6.3 \\ \hline 400.0 & 24.1 \\ \hline \end{tabular}
Step by Step Solution
There are 3 Steps involved in it
1 Expert Approved Answer
Step: 1 Unlock

Question Has Been Solved by an Expert!
Get step-by-step solutions from verified subject matter experts
Step: 2 Unlock
Step: 3 Unlock