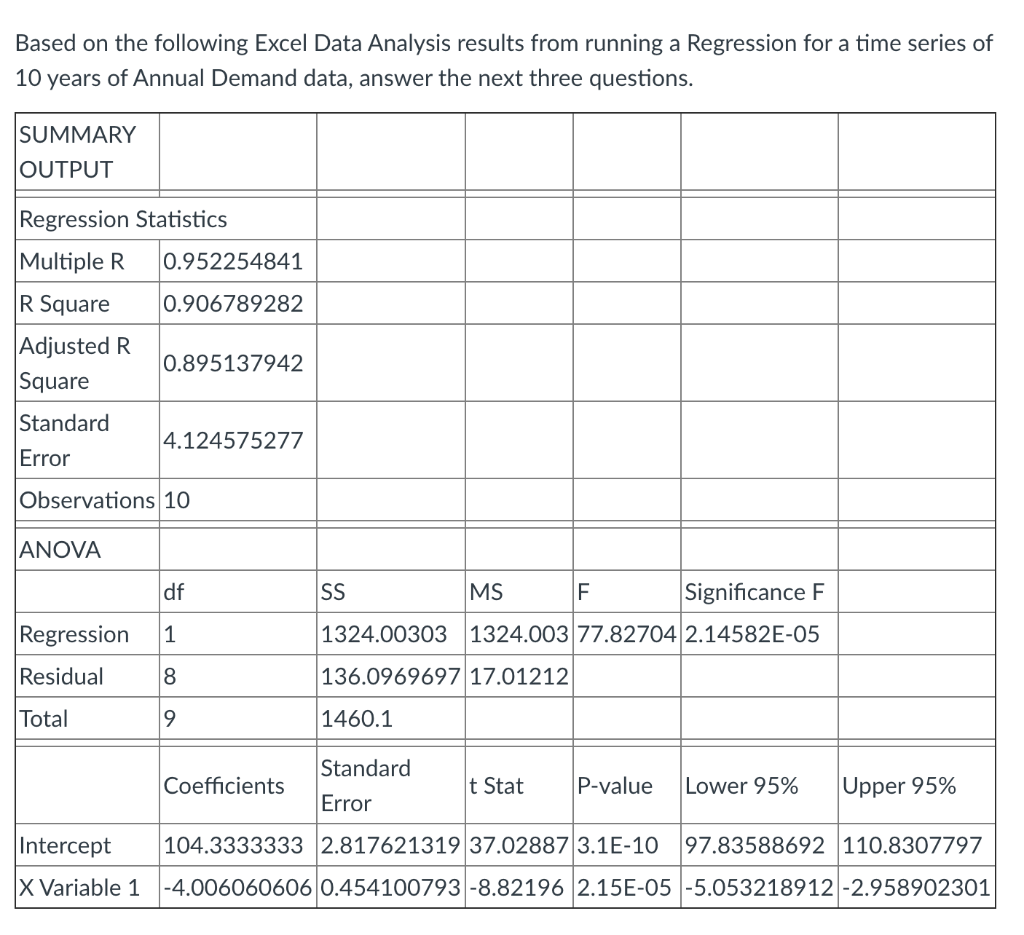
Question: Based on the following Excel Data Analysis results from running a Regression for a time series of 10 years of Annual Demand data, answer the

Based on the following Excel Data AnalysisBased on the following Excel Data Analysis

Based on the following Excel Data Analysis results from running a Regression for a time series of 10 years of Annual Demand data, answer the next three questions. SUMMARY OUTPUT Regression Statistics Multiple R. 0.952254841 R Square 0.906789282 Adjusted R 0.895137942 Square Standard 4.124575277 Error Observations 10 ANOVA df SS MS F Significance F Regression 1 1324.00303 1324.003 77.82704 2.14582E-05 Residual 8 136.0969697 17.01212 Total 9 1460.1 Coefficients Standard Error t Stat P-value Lower 95% Upper 95% Intercept 104.3333333 2.817621319 37.02887 3.1E-10 97.83588692 110.8307797 X Variable 1 -4.006060606 0.454100793 -8.82196 2.15E-05 -5.053218912 -2.958902301 Which statistic is the coefficient of determination? Residual, 136.0969 Standard error, 4.12457 O Intercept, 104.333 R Square, 0.906789 Question 8 What is the forecast for Year 15, based on the given Excel Data Analysis results? 1560.944 95.30053 164.42 44.24

Step by Step Solution

There are 3 Steps involved in it

1 Expert Approved Answer
Step: 1 Unlock blur-text-image
Question Has Been Solved by an Expert!

Get step-by-step solutions from verified subject matter experts

Step: 2 Unlock
Step: 3 Unlock

Students Have Also Explored These Related General Management Questions!