

Question: Based on the following information, calculate the NPV Analysis Grid: NPV vs Discount Rate & Year 1 Sales Ranges table. CoursHeroTranscribedText 22 = Net Income
Based on the following information, calculate the NPV Analysis Grid: NPV vs Discount Rate & Year 1 Sales Ranges table.
CoursHeroTranscribedText
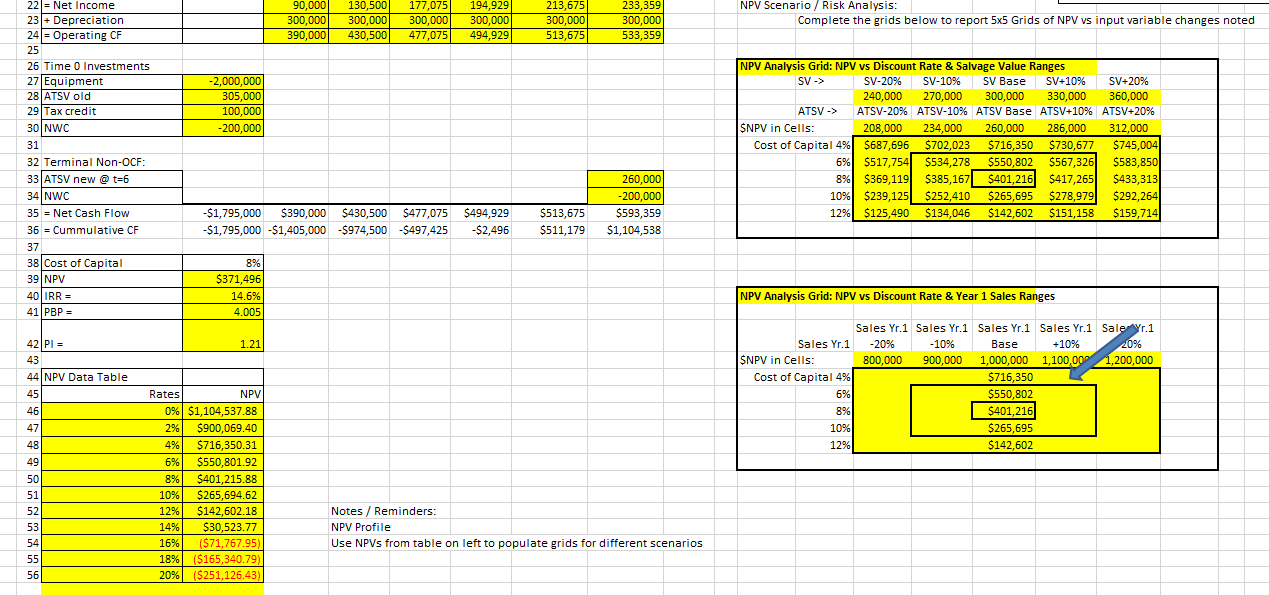
22 = Net Income 23 + Depreciation 24 Operating CF 25 90,000 130,500 177,075 194,929 213,675 233,359 300,000 300,000 300,000 300,000 300,000 300,000 390,000 430,500 477,075 494,929 513,675 533,359 29 Tax credit 30 NWC 31 32 Terminal Non-OCF: 33 ATSV new @ t=6 34 NWC 35 = Net Cash Flow 26 Time 0 Investments 27 Equipment -2,000,000 28 ATSV old 305,000 100,000 -200,000 260,000 -200,000 36 = Cummulative CF -$1,795,000 $390,000 $430,500 $477,075 $494,929 -$1,795,000-$1,405,000 $974,500 -$497,425 -$2,496 $513,675 $511,179 $593,359 $1,104,538 37 38 Cost of Capital 39 NPV 40 IRR = 41 PBP = 42|PI = 43 44 NPV Data Table 8% $371,496 14.6% 4.005 1.21 45 46 47 48 Rates NPV 0% $1,104,537.88 2% $900,069.40 4% $716,350.31 49 6% $550,801.92 50 8% $401,215.88 51 10% $265,694.62 52 12% $142,602.18 Notes / Reminders: 53 14% 54 16% $30,523.77 ($71,767.95) NPV Profile Use NPVs from table on left to populate grids for different scenarios 55 18% ($165,340.79) 56 20% ($251,126.43) NPV Scenario / Risk Analysis: Complete the grids below to report 5x5 Grids of NPV vs input variable changes noted NPV Analysis Grid: NPV vs Discount Rate & Salvage Value Ranges SV -> ATSV -> SV-20% SV-10% SV Base SV+10% SV+20% 240,000 270,000 300,000 330,000 360,000 ATSV-20% ATSV-10% ATSV Base ATSV+10% ATSV+20% SNPV in Cells: 208,000 234,000 260,000 286,000 312,000 Cost of Capital 4% $687,696, $702,023 $716,350 $730,677 $745,004 6% $517,754 $534,278 $550,802 $567,326 $583,850 8% $369,119 $385,167 $401,216 $417,265 $433,313 10% $239,125 $252,410 $265,695 $278,979 $292,264 12% $125,490 $134,046 $142,602 $151,158 $159,714 NPV Analysis Grid: NPV vs Discount Rate & Year 1 Sales Ranges Sales Yr.1 SNPV in Cells: Cost of Capital 4% Sales Yr.1 Sales Yr.1 Sales Yr.1 Sales Yr.1 Sale Yr.1 -20% -10% Base +10% 20% 800,000 900,000 1,000,000 1,100,000 1,200,000 $716,350 6% $550,802 8% $401,216 10% $265,695 12% $142,602
Step by Step Solution
There are 3 Steps involved in it
To create the NPV Analysis Grid based on the given information we will fill out tables displaying th... View full answer

Get step-by-step solutions from verified subject matter experts