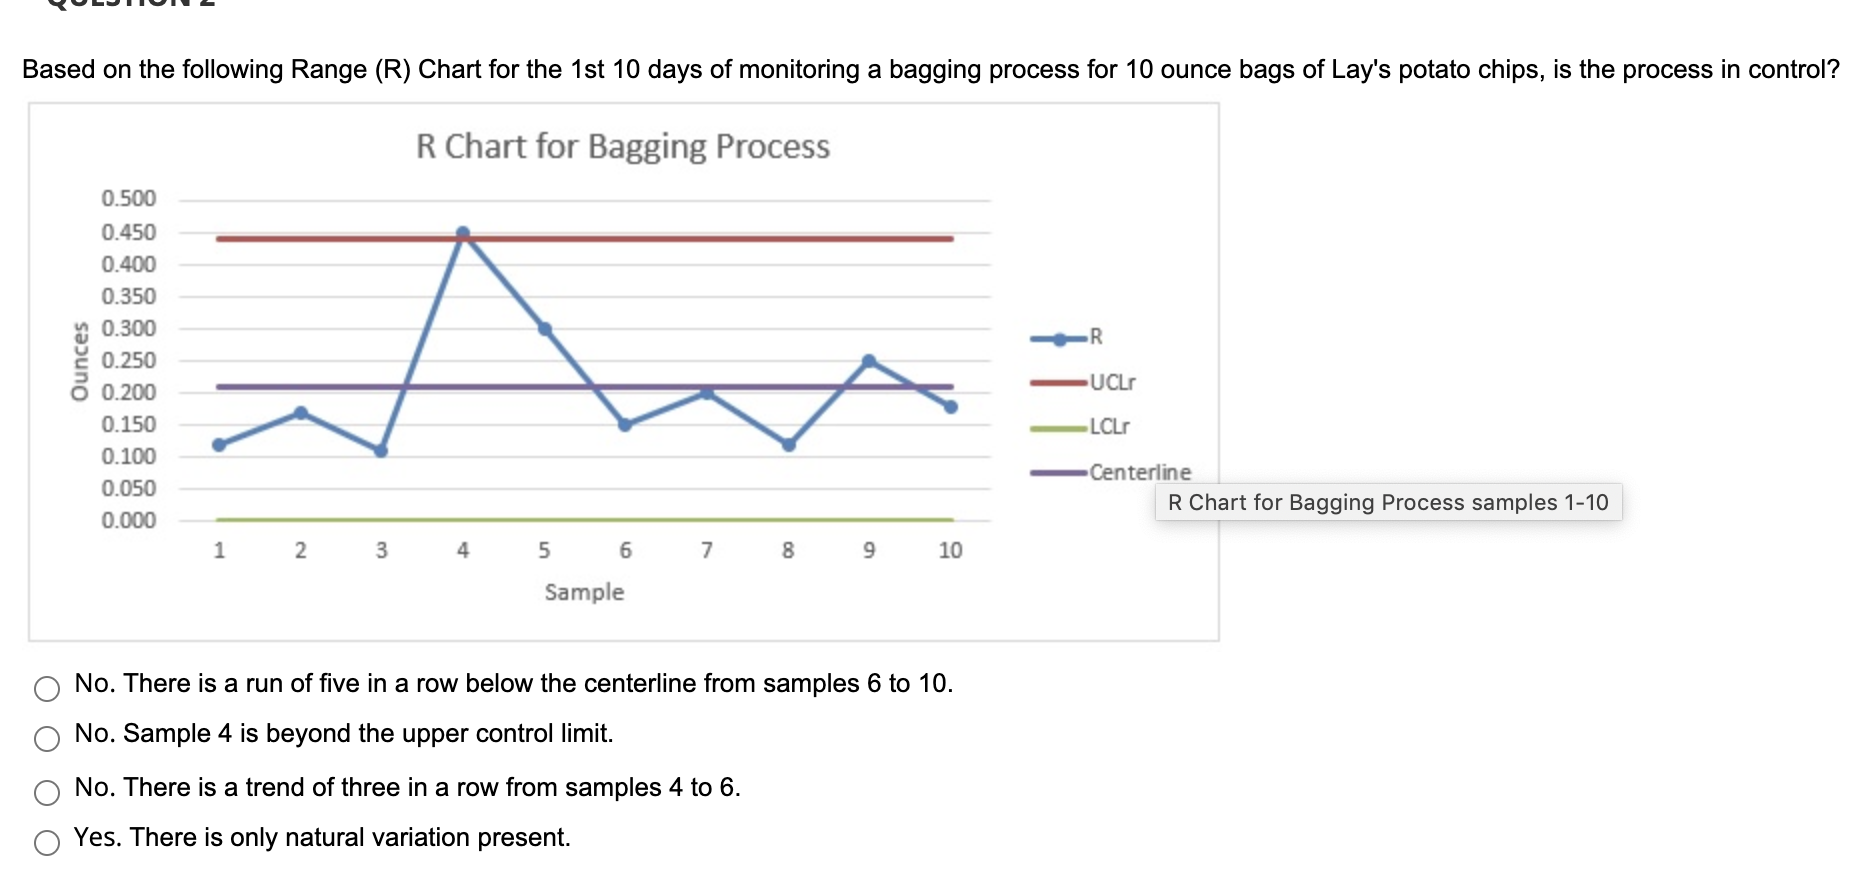
Question: Based on the following Range (R) Chart for the 1st 10 days of monitoring a bagging process for 10 ounce bags of Lay's potato chips,

Based on the following Range (R) Chart for the

Based on the following Range (R) Chart for the

Based on the following Range (R) Chart for the 1st 10 days of monitoring a bagging process for 10 ounce bags of Lay's potato chips, is the process in control? R Chart for Bagging Process R Ounces 0.500 0.450 0.400 0.350 0.300 0.250 0.200 0.150 0.100 0.050 0.000 UCLE -LCL -Centerline R Chart for Bagging Process samples 1-10 1 N 3 4 5 6 7 8 9 10 Sample No. There is a run of five in a row below the centerline from samples 6 to 10. No. Sample 4 is beyond the upper control limit. No. There is a trend of three in a row from samples 4 to 6. Yes. There is only natural variation present. Based on the following X-bar Chart for the 1st 10 days of Monitoring a bagging process for 10 ounce bags of Lay's potato chips, is the process in control? X-bar Chart for Bagging Process 10.10 10.05 10.00 A Xbar Ounces 9.95 UCLX 9.90 -LCLX 9.85 -Centerline 9.80 1 2 3 4 5 6 7 8 9 10 Sample Yes. There is only natural variation present. No. There is a run of four in a row above the centerline from samples 4 to 7. No. There are two points near the upper control limit on samples 2 and 7. No. There is a trend of five in a row from samples 3 to 7

Step by Step Solution

There are 3 Steps involved in it

1 Expert Approved Answer
Step: 1 Unlock blur-text-image
Question Has Been Solved by an Expert!

Get step-by-step solutions from verified subject matter experts

Step: 2 Unlock
Step: 3 Unlock

Students Have Also Explored These Related General Management Questions!