

Question: based on the graphs, describe the relationship between the two graphs. ffBelow are the average SAT scores for high school seniors in each state and
- based on the graphs, describe the relationship between the two graphs.
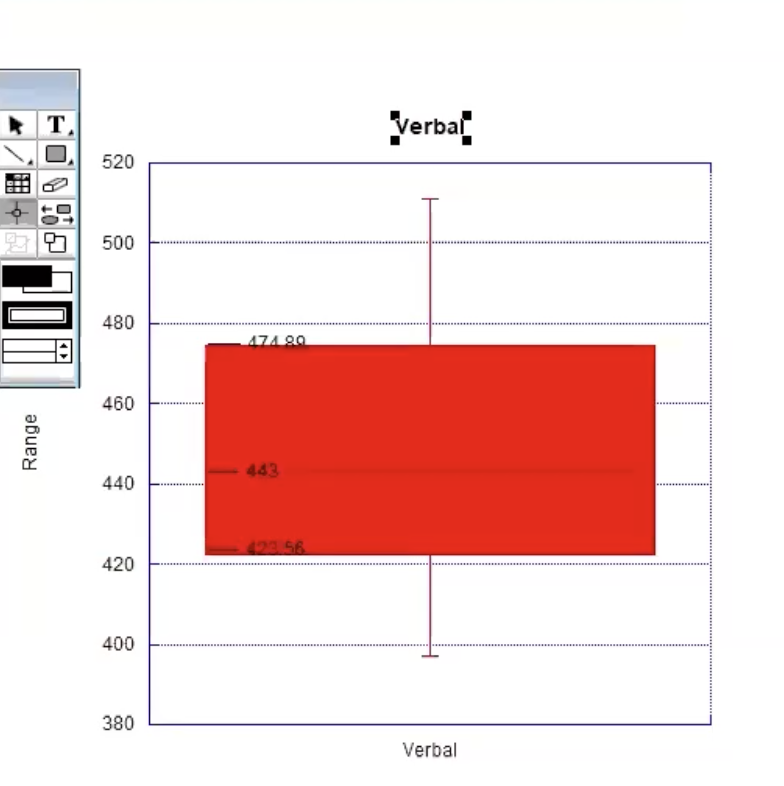
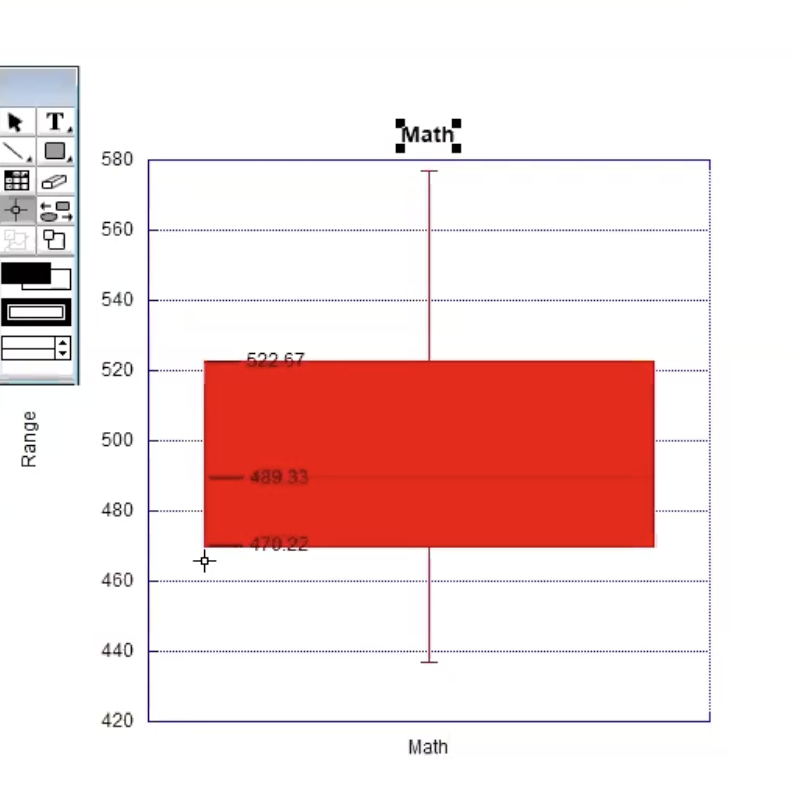
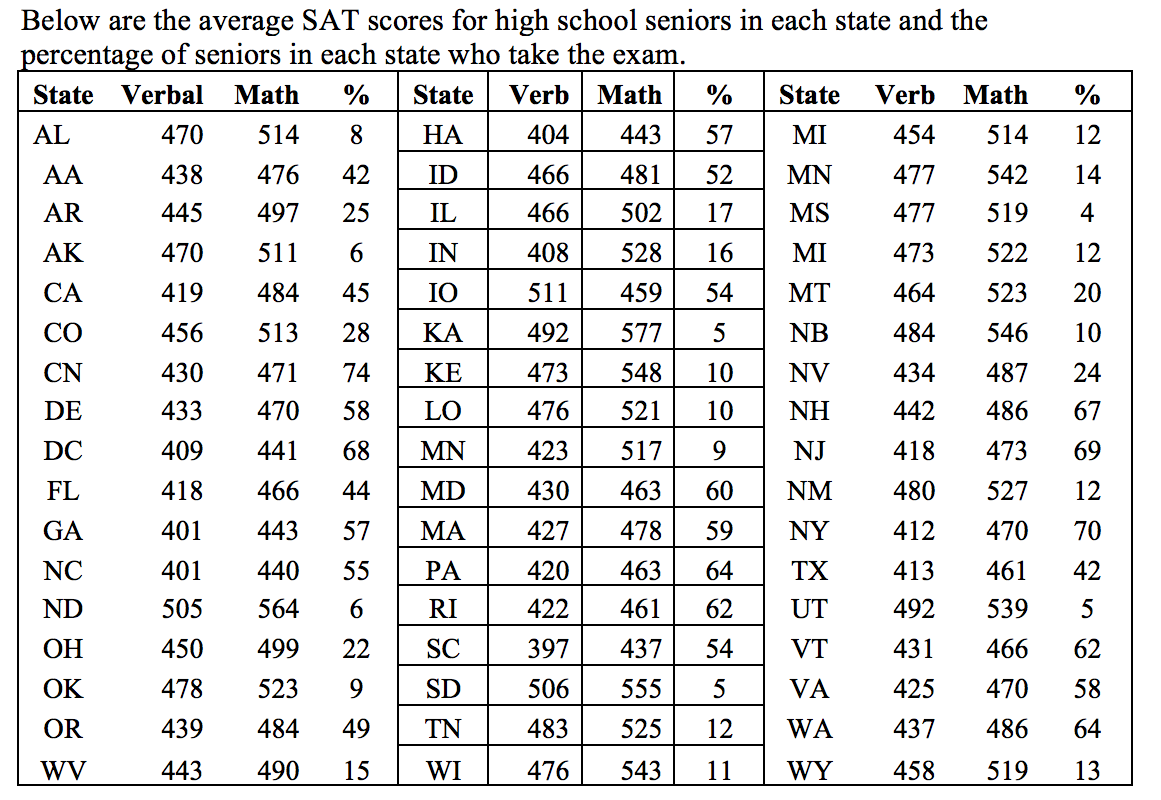
\f\fBelow are the average SAT scores for high school seniors in each state and the u'ercenta e of seniors in each state who take the exam. State Verbal Math mm State Verb Math 8--- 57 52 -\" 59 54 54 5 11
Step by Step Solution
There are 3 Steps involved in it
1 Expert Approved Answer
Step: 1 Unlock

Question Has Been Solved by an Expert!
Get step-by-step solutions from verified subject matter experts
Step: 2 Unlock
Step: 3 Unlock