

Question: Based on the information contained in these financial statements, compute free cash flow for Amazon at December 31, 2016 and Wal-Mart for January 31, 2017.
Based on the information contained in these financial statements, compute free cash flow for Amazon at December 31, 2016 and Wal-Mart for January 31, 2017. What conclusions concerning the management of cash can be drawn from free cash flow for each company?
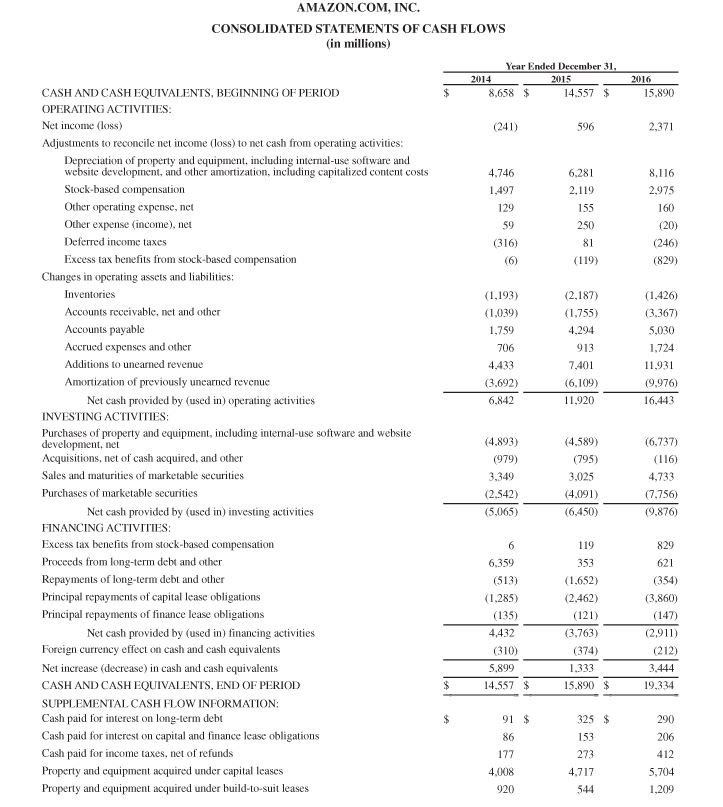
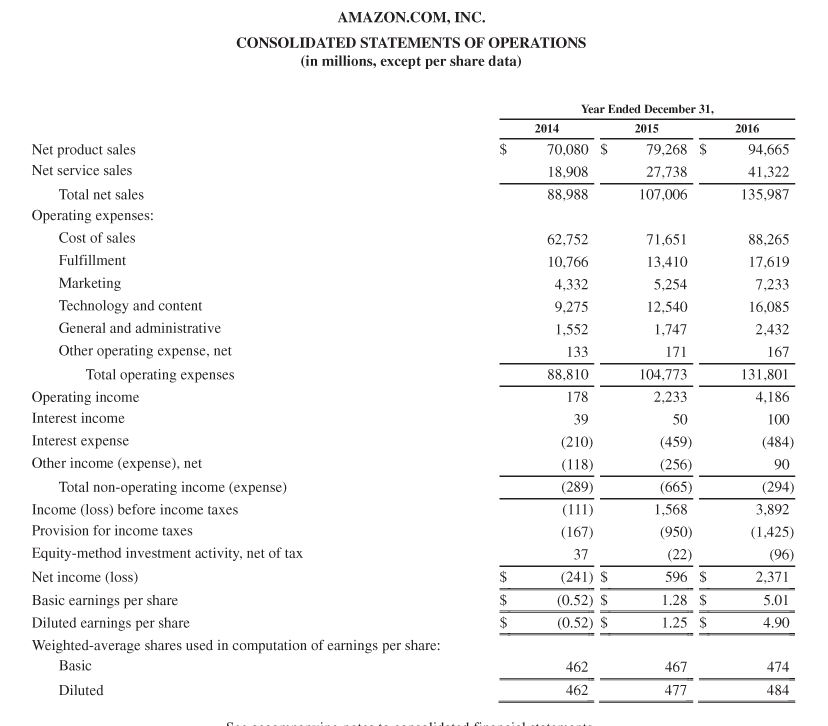
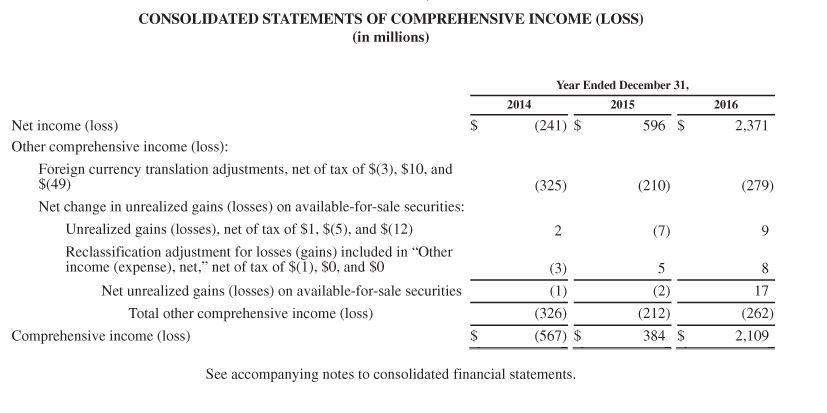
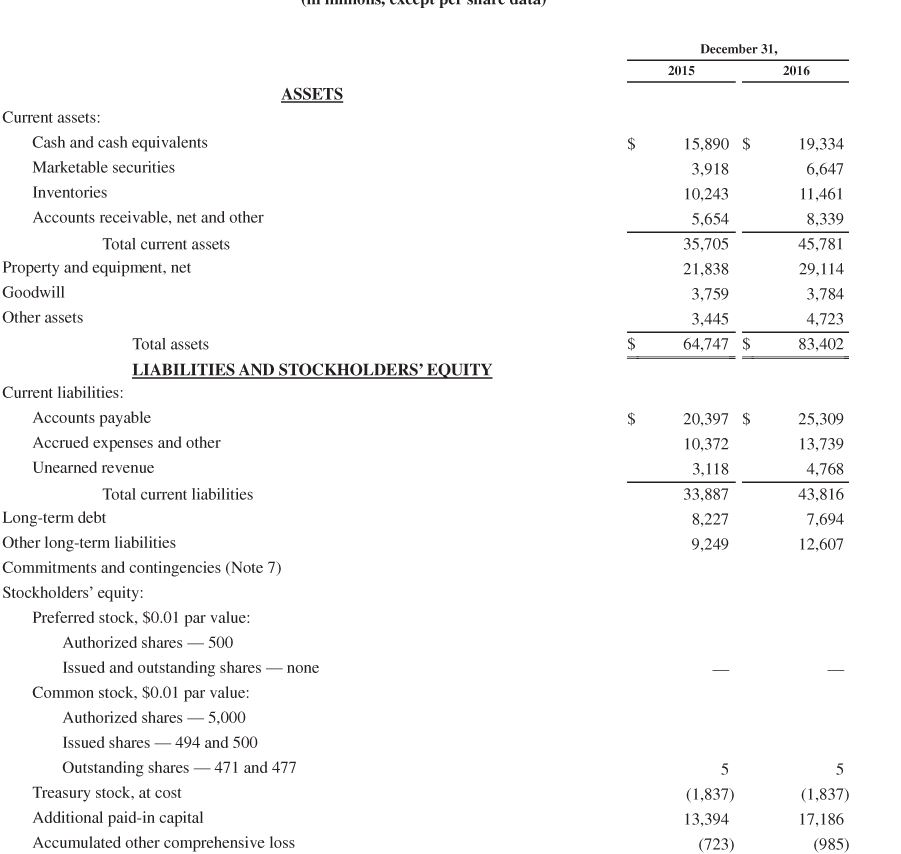
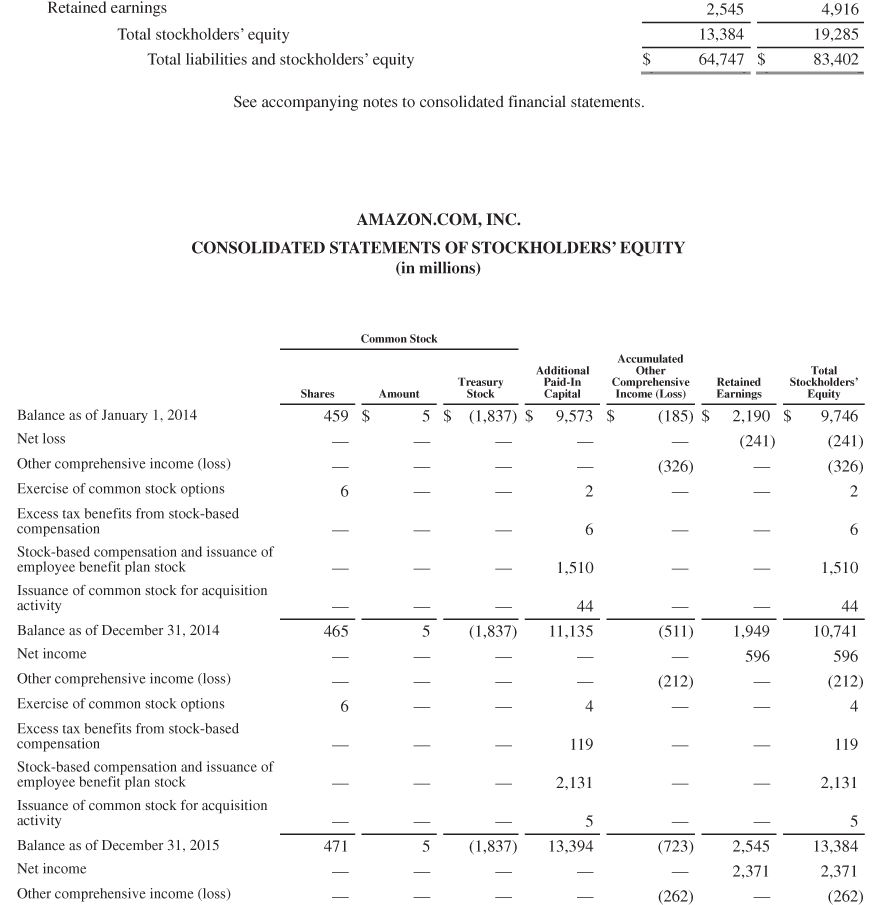
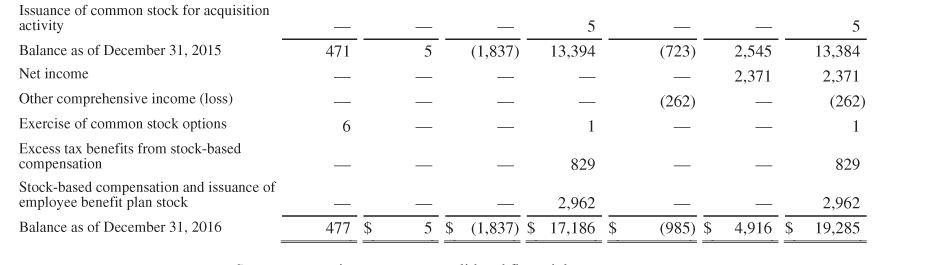
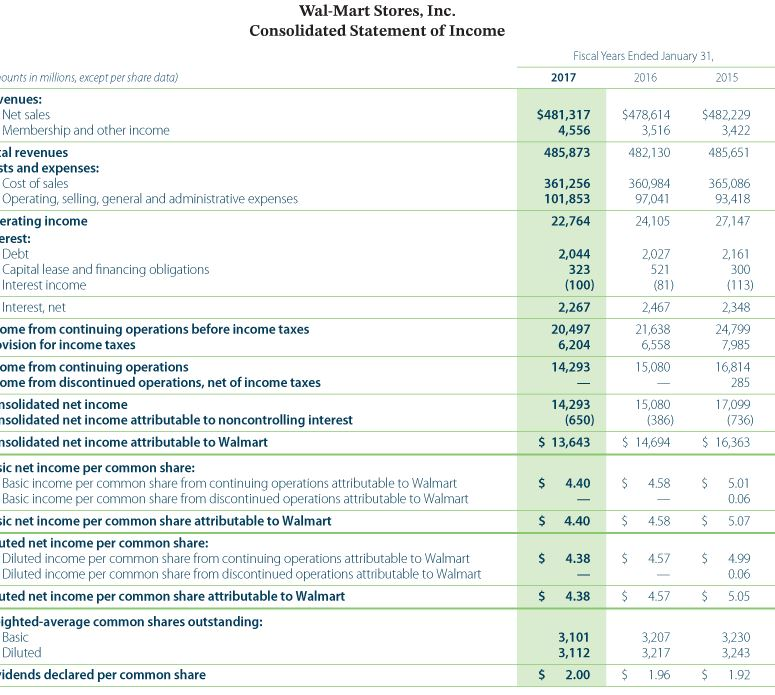
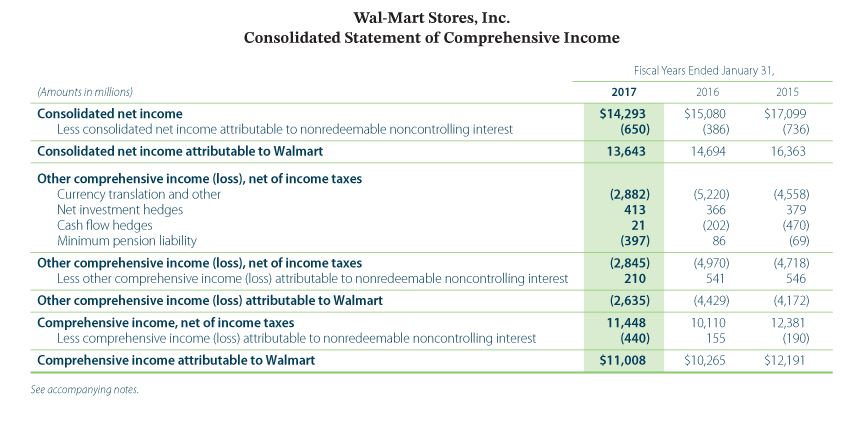
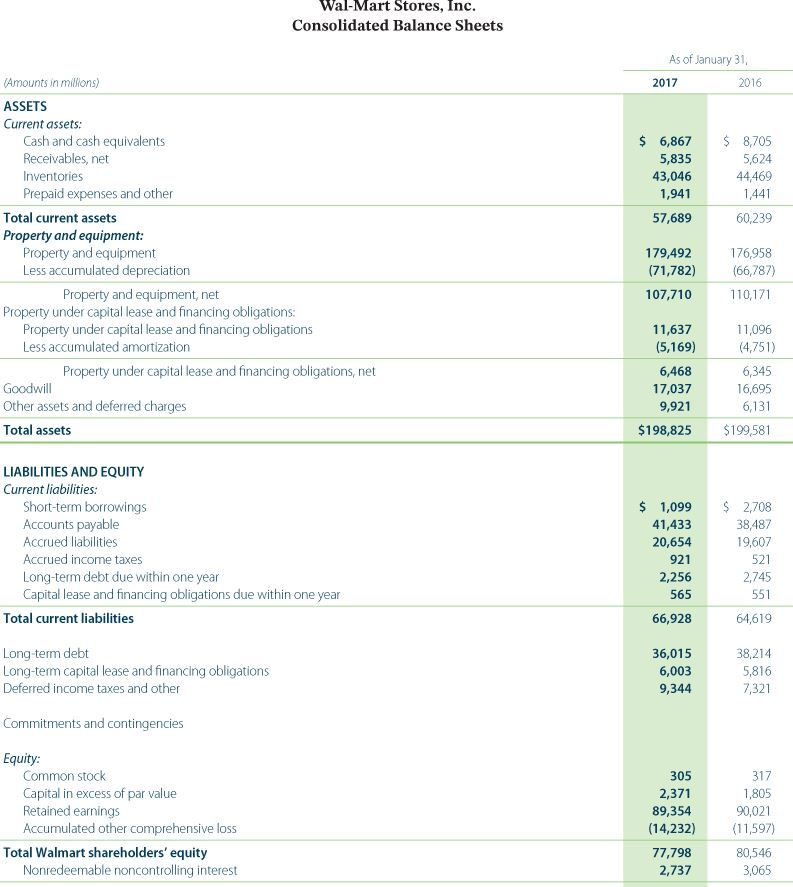
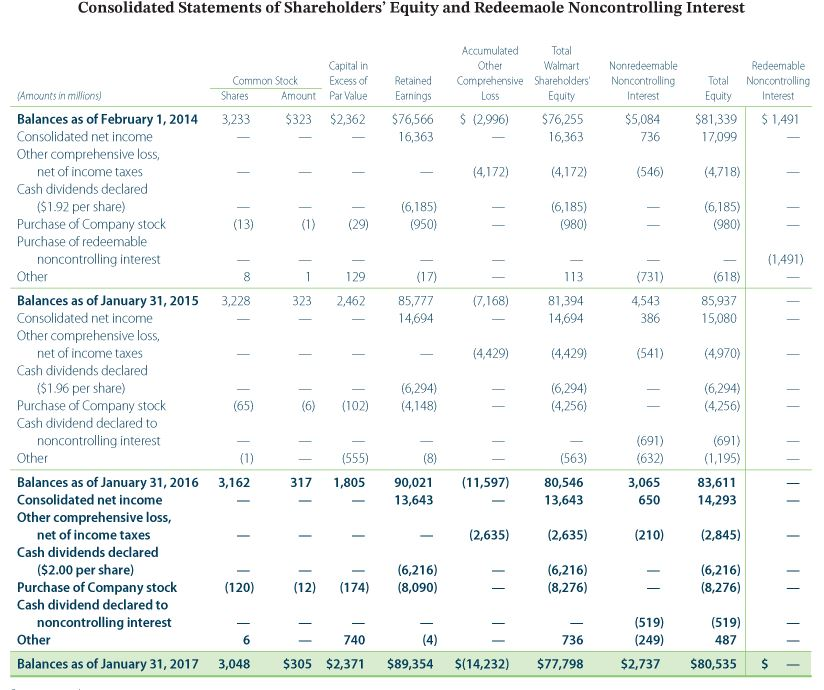
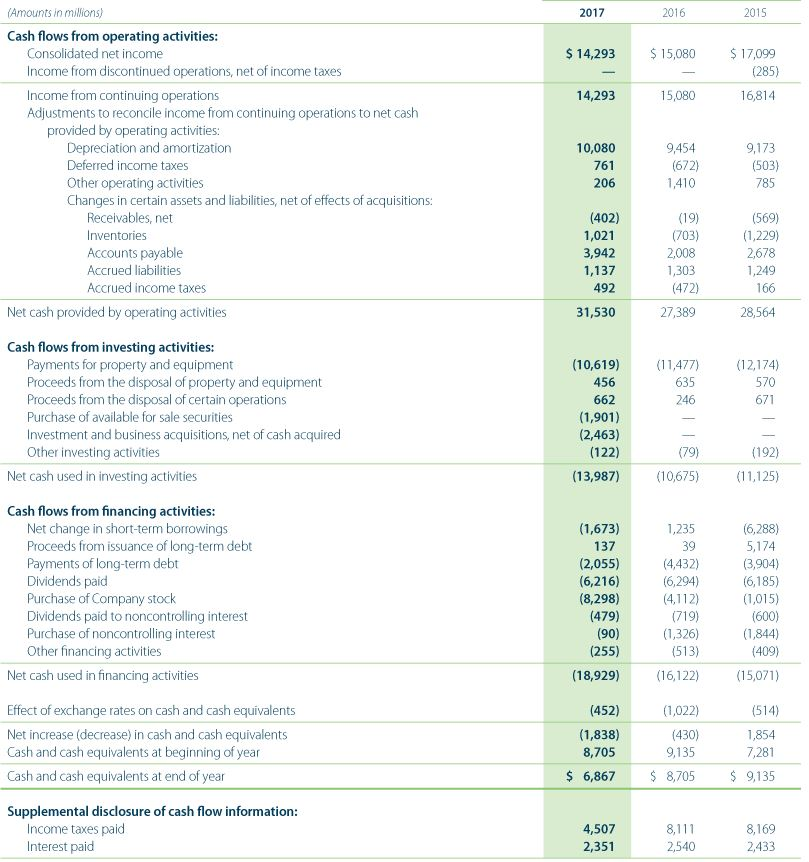
AMAZON.COM, INC. CONSOLIDATED STATEMENTS OF CASH FLOWS in millions) Year Ended December 31, 2014 2015 2016 $ 8,658 $ 14.557 $ 15,890 (241) 596 2,371 4.746 1,497 129 6,281 2,119 155 250 8,116 2,975 160 (20) (246) (829) (316) 81 (6) (119) (1,193) (1,039) 1,759 706 4,433 (3,692) (2,187) (1,755) 4.294 913 7,401 (6,109) 11,920 (1,426) (3.367) 5,030 1.724 11,931 (9.976) 16,443 6.842 CASH AND CASH EQUIVALENTS, BEGINNING OF PERIOD OPERATING ACTIVITIES: Net income (loss) Adjustments to reconcile net income (loss) to net cash from operating activities: Depreciation of property and equipment, including internal-use software and website development, and other amortization, including capitalized content costs Stock-based compensation Other operating expense, net Other expense (income), net Deferred income taxes Excess tax benefits from stock-based compensation Changes in operating assets and liabilities: Inventories Accounts receivable, net and other Accounts payable Accrued expenses and other Additions to unearned revenue Amortization of previously unearned revenue Net cash provided by (used in) operating activities INVESTING ACTIVITIES: Purchases of property and equipment, including internal-use software and website development, net Acquisitions, net of cash acquired, and other Sales and maturities of marketable securities Purchases of marketable securities Net cash provided by (used in) investing activities FINANCING ACTIVITIES: Excess tax benefits from stock-based compensation Proceeds from long-term debt and other Repayments of long-term debt and other Principal repayments of capital lease obligations Principal repayments of finance lease obligations Net cash provided by (used in) financing activities Foreign currency effect on cash and cash equivalents Net increase (decrease) in cash and cash equivalents CASH AND CASH EQUIVALENTS, END OF PERIOD SUPPLEMENTAL CASH FLOW INFORMATION: Cash paid for interest on long-term debt Cash paid for interest on capital and finance lease obligations Cash paid for income taxes, net of refunds Property and equipment acquired under capital leases Property and equipment acquired under build-to-suit leases 4,893) (979) 3,349 (2.542) (5.065) 4.589) (795) 3,025 (4.091) (6,450) (6,737) (116) 4,733 (7.756) (9,876 6.359 (513) (1.285) (135) 4,432 (310) 5.899 14,557 119 353 (1,652) (2.462) (121) (3.763) (374) 1.333 15,890 829 621 (354) (3.860) (147) (2,911) (212) 3.444 19,334 $ $ 91 $ 86 325 $ 153 273 4.717 177 4.008 920 290 206 412 5,704 1,209 544 AMAZON.COM, INC. CONSOLIDATED STATEMENTS OF OPERATIONS (in millions, except per share data) Year Ended December 31, 2014 2015 70,080 S 79,268 $ 18.908 27.738 88.988 107,006 2016 94,665 41.322 135,987 88,265 17.619 7,233 16.085 2,432 167 131,801 Net product sales Net service sales Total net sales Operating expenses: Cost of sales Fulfillment Marketing Technology and content General and administrative Other operating expense, net Total operating expenses Operating income Interest income Interest expense Other income (expense), net Total non-operating income (expense) Income (loss) before income taxes Provision for income taxes Equity-method investment activity, net of tax Net income (loss) Basic earnings per share Diluted earnings per share Weighted average shares used in computation of earnings per share: Basic Diluted 62.752 10.766 4,332 9.275 1,552 133 88.810 178 39 (210) (118) (289) (111) (167) 4.186 71,651 13,410 5,254 12.540 1,747 171 104.773 2.233 50 (459) (256) (665) 1,568 (950) (22) 596 S 1.28 S 1.25 $ 100 (484) 90 (294) 3.892 (1.425) (96) ,371 5.01 4.90 37 2 Alla! (241) S (0.52) S (0.52) $ 462 467 474 484 462 CONSOLIDATED STATEMENTS OF COMPREHENSIVE INCOME (LOSS) (in millions) 2014 Year Ended December 31, 2015 (241) $ 596 S 2016 2,371 (325) (210) (279) Net income (loss) Other comprehensive income (loss): Foreign currency translation adjustments, net of tax of $(3). $10, and $(49) Net change in unrealized gains (losses) on available-for-sale securities: Unrealized gains (losses), net of tax of $1. $(5), and $(12) Reclassification adjustment for losses (gains) included in "Other income (expense), net," net of tax of $(1). SO, and SO Net unrealized gains (losses) on available-for-sale securities Total other comprehensive income (loss) Comprehensive income (loss) $ (1) (326) (567) $ (212) 384 S 2,109 See accompanying notes to consolidated financial statements. UK, LALPU PU Sail udla December 31, 2015 2016 15,890 $ 3,918 10,243 5,654 35,705 21,838 3,759 3,445 64,747 $ 19,334 6,647 11,461 8,339 45,781 29,114 3,784 4,723 83,402 $ ASSETS Current assets: Cash and cash equivalents Marketable securities Inventories Accounts receivable, net and other Total current assets Property and equipment, net Goodwill Other assets Total assets LIABILITIES AND STOCKHOLDERS' EQUITY Current liabilities: Accounts payable Accrued expenses and other Unearned revenue Total current liabilities Long-term debt Other long-term liabilities Commitments and contingencies (Note 7) Stockholders' equity: Preferred stock, $0.01 par value: Authorized shares-500 Issued and outstanding shares none Common stock, $0.01 par value: Authorized shares - 5,000 Issued shares - 494 and 500 Outstanding shares - 471 and 477 Treasury stock, at cost Additional paid-in capital Accumulated other comprehensive loss 20,397 $ 10,372 3,118 33,887 8,227 9,249 25,309 13,739 4,768 43,816 7,694 12,607 (1.837) 13,394 (723) (1,837) 17,186 (985) Retained earnings Total stockholders' equity Total liabilities and stockholders' equity 2,545 13,384 64,747 $ 4,916 19,285 83,402 $ See accompanying notes to consolidated financial statements. AMAZON.COM, INC. CONSOLIDATED STATEMENTS OF STOCKHOLDERS' EQUITY (in millions) Common Stock Retained Earnings Shares 459 $ Accumulated Additional Other Treasury Paid-In Comprehensive Stock Capital Income (Loss) (1,837) $ 9,573 $ Amount 5 $ Total Stockholders Equity 9,746 (241) (326) (241) (326) 1,510 1.510 44 44 11,135 (1,837) 1,949 Balance as of January 1, 2014 Net loss Other comprehensive income (loss) Exercise of common stock options Excess tax benefits from stock-based compensation Stock-based compensation and issuance of employee benefit plan stock Issuance of common stock for acquisition activity Balance as of December 31, 2014 Net income Other comprehensive income (loss) Exercise of common stock options Excess tax benefits from stock-based compensation Stock-based compensation and issuance of employee benefit plan stock Issuance of common stock for acquisition activity Balance as of December 31, 2015 Net income Other comprehensive income (loss) 596 10,741 596 (212) 119 2.131 2.131 (1,837) 13,394 2,545 2,371 13,384 2,371 (262) 477-5 (1.837) 13.394(723) 2.545 2,371 (1.837) $7) 13,394 2,545 13,384 2,371 (262) (262) Issuance of common stock for acquisition activity Balance as of December 31, 2015 Net income Other comprehensive income (loss) Exercise of common stock options Excess tax benefits from stock-based compensation Stock-based compensation and issuance of employee benefit plan stock Balance as of December 31, 2016 829 829 2,962 17,186 2,962 19,285 477 $ 5 $ (1,837) $ $ (985) $ 4,916 $ Wal-Mart Stores, Inc. Consolidated Statement of Income Fiscal Years Ended January 31, 2017 2016 2015 $481,317 4,556 485,873 $478,614 3,516 482,130 $482,229 3,422 485,651 361,256 101,853 22,764 360,984 97,041 24,105 365,086 93,418 27,147 2,044 323 (100) 2,267 20,497 6,204 14,293 2,027 521 (81) 2,467 21,638 6,558 15,080 mounts in millions except per share data) Jenues: Net sales Membership and other income Cal revenues sts and expenses: Cost of sales Operating, selling, general and administrative expenses erating income erest: Debt Capital lease and financing obligations Interest income Interest, net ome from continuing operations before income taxes vision for income taxes ome from continuing operations ome from discontinued operations, net of income taxes nsolidated net income nsolidated net income attributable to noncontrolling interest nsolidated net income attributable to Walmart sic net income per common share: Basic income per common share from continuing operations attributable to Walmart Basic income per common share from discontinued operations attributable to Walmart sic net income per common share attributable to Walmart uted net income per common share: Diluted income per common share from continuing operations attributable to Walmart Diluted income per common share from discontinued operations attributable to Walmart uted net income per common share attributable to Walmart ighted-average common shares outstanding: Basic Diluted -idends declared per common share 2,161 300 (113) 2,348 24,799 7,985 16,814 285 17,099 (736) $ 16,363 - 14,293 (650) 15,080 (386) $ 14,694 $ 13,643 $ 4.40 $ 458 $ 5.01 0.06 5.07 $ 4.40 $ 4.58 $ $ 4.38 $ 4.57 $ 4.99 0.06 5.05 $ 4.38 $ 4.57 $ 3,101 3,112 2.00 3,207 3,217 1.96 3,230 3,243 1.92 $ $ $ Wal-Mart Stores, Inc. Consolidated Statement of Comprehensive Income (Amounts in millions) Consolidated net income Less consolidated net income attributable to nonredeemable noncontrolling interest Consolidated net income attributable to Walmart Fiscal Years Ended January 31, 2017 2016 2015 $14,293 $15,080 $17,099 (650) (386) (736) 13,643 14,694 16,363 (5,220) 366 (202) 86 Other comprehensive income (loss), net of income taxes Currency translation and other Net investment hedges Cash flow hedges Minimum pension liability Other comprehensive income (loss), net of income taxes Less other comprehensive income (loss) attributable to nonredeemable noncontrolling interest Other comprehensive income (loss) attributable to Walmart Comprehensive income, net of income taxes Less comprehensive income (loss) attributable to nonredeemable noncontrolling interest Comprehensive income attributable to Walmart (2,882) 413 21 (397) (2,845) 210 (2,635) 11,448 (440) $11,008 (4,970) 541 (4,429) (4,558) 379 (470) (69) (4,718) 546 (4,172) 12,381 (190) $12,191 10,110 155 $10,265 See accompanying notes Wal-Mart Stores, Inc. Consolidated Balance Sheets As of January 31 2017 2016 $ 6,867 5,835 43,046 1,941 $ 8,705 5624 44,469 1,441 60,239 57,689 Amounts in millions) ASSETS Current assets: Cash and cash equivalents Receivables, net Inventories Prepaid expenses and other Total current assets Property and equipment: Property and equipment Less accumulated depreciation Property and equipment, net Property under capital lease and financing obligations: Property under capital lease and financing obligations Less accumulated amortization Property under capital lease and financing obligations, net Goodwill Other assets and deferred charges Total assets 179,492 (71,782) 176,958 (66,787) 110,171 107,710 11,637 (5,169) 6,468 17,037 9,921 $198,825 11,096 (4,751) 6,345 16,695 6,131 $199,581 $ LIABILITIES AND EQUITY Current liabilities: Short-term borrowings Accounts payable Accrued liabilities Accrued income taxes Long-term debt due within one year Capital lease and financing obligations due within one year Total current liabilities $ 1,099 41,433 20,654 921 2,256 565 66,928 2,708 38,487 19,607 521 2,745 551 64,619 Long-term debt Long-term capital lease and financing obligations Deferred income taxes and other 36,015 6,003 9,344 38,214 5,816 7,321 Commitments and contingencies Equity: Common stock Capital in excess of par value Retained earnings Accumulated other comprehensive loss Total Walmart shareholders' equity Nonredeemable noncontrolling interest 305 2,371 89,354 (14,232) 77,798 2,737 317 1,805 90,021 (11,597) 80,546 3,065 Consolidated Statements of Shareholders' Equity and Redeemaole Noncontrolling Interest Capital in Common Stock Excess of Excess of Shares Amount Par Value 3,233 $323 $2,362 Amounts in milions Nonredeemable Noncontrolling Interest Accumulated Total Other Walmart Comprehensive Shareholders' Commerce Loss Equity $ (2,996) $76,255 16,363 Retained Retained Earnings $76,566 16,363 Total Equity $81,339 17,099 Redeemable Noncontrolling Interest $1,491 $5,084 736 - - - (4,172) (4,172) (546) (4,718) (6,185) (950) (6,185) (980) (6,185) (980) (1,491) 129 (17) 113 (618) (731) 4,543 3,228 2,462 (7,168) 85,777 14,694 81,394 14,694 386 85,937 15,080 (4,429) (4,429) (541) (4,970) Balances as of February 1, 2014 Consolidated net income Other comprehensive loss, net of income taxes Cash dividends declared ($1.92 per share) Purchase of Company stock Purchase of redeemable noncontrolling interest Other Balances as of January 31, 2015 Consolidated net income Other comprehensive loss, net of income taxes Cash dividends declared ($1.96 per share) Purchase of Company stock Cash dividend declared to noncontrolling interest Other Balances as of January 31, 2016 Consolidated net income Other comprehensive loss, net of income taxes Cash dividends declared ($2.00 per share) Purchase of Company stock Cash dividend declared to noncontrolling interest Other Balances as of January 31, 2017 (102) (6,294) (4,148) (6,294) (4,256) (6,294) (4,256) (555) 1,805 (691) (632) 3,065 (8) 90,021 13,643 3,162 (691) (1,195) 83,611 14,293 317 (563) 80,546 13,643 (11,597) 650 (2,635) (2,635) (210) (2,845) (6,216) (8,090) (6,216) (8,276) (6,216) (8,276) (120) (174) - 6 3,048 - 740 $305 $2,371 (4) $89,354 - 736 $77,798 (519) (249) $2,737 (519) 487 $80,535 $(14,232) $ - (Amounts in millions) 2017 2016 2015 $14,293 $ 15,080 $ 17,099 (285) 14,293 15,080 16,814 Cash flows from operating activities: Consolidated net income Income from discontinued operations, net of income taxes Income from continuing operations Adjustments to reconcile income from continuing operations to net cash provided by operating activities: Depreciation and amortization Deferred income taxes Other operating activities Changes in certain assets and liabilities, net of effects of acquisitions: Receivables, net Inventories Accounts payable Accrued liabilities Accrued income taxes Net cash provided by operating activities 10,080 761 206 9,454 (672) 1,410 9,173 (503) 785 (402) 1,021 3,942 1,137 492 (19) (703) 2,008 1,303 (472) 27,389 (569) (1,229) 2,678 1,249 166 31,530 28,564 (11,477) 635 (12,174) 570 671 246 Cash flows from investing activities: Payments for property and equipment Proceeds from the disposal of property and equipment Proceeds from the disposal of certain operations Purchase of available for sale securities Investment and business acquisitions, net of cash acquired Other investing activities Net cash used in investing activities (10,619) 456 662 (1,901) (2,463) (122) (13,987) (79) (10,675) (192) (11.125) Cash flows from financing activities: Net change in short-term borrowings Proceeds from issuance of long-term debt Payments of long-term debt Dividends paid Purchase of Company stock Dividends paid to noncontrolling interest Purchase of noncontrolling interest Other financing activities Net cash used in financing activities (1,673) 137 (2,055) (6,216) (8,298) (479) (90) (255) (18,929) 1,235 39 (4,432) (6,294) (4,112) (719) (1,326) (513) (16,122) (6,288) 5,174 (3,904) 6,185) (1,015) (600) (1,844) (409) (15,071) (1,022) (430) Effect of exchange rates on cash and cash equivalents Net increase (decrease) in cash and cash equivalents Cash and cash equivalents at beginning of year Cash and cash equivalents at end of year (452) (1,838) 8,705 $ 6,867 (514) 1,854 7,281 $ 9,135 9,135 $ 8,705 Supplemental disclosure of cash flow information: Income taxes paid Interest paid 4,507 2,351 8,111 2,540 8,169 2,433
Step by Step Solution
There are 3 Steps involved in it

Get step-by-step solutions from verified subject matter experts