

Question: Based on the information in the Portfolio Analysis Problems Data 04 22 23A Excel file, what is the average risk-free rate over the 60-year period?
Based on the information in the Portfolio Analysis Problems Data 04 22 23A Excel file, what is the average risk-free rate over the 60-year period?
| Less than 0.50% | ||
| Between 0.50% and 1.00% | ||
| Between 1.00% and 2% | ||
| Between 2% and 3% | ||
| More than 3% |
QUESTION 2
Based on the information in the Portfolio Analysis Problems Data 04 22 23A Excel file, what is the average annual market return over the 60-year period?
| Less than 4%
| ||
| Between 4% and 8%
| ||
| Between 8% and 12%
| ||
| Between 12% and 16%
| ||
| More than 16% |
QUESTION 3
Based on the information in the Portfolio Analysis Problems Data 04 22 23A Excel file, what is the standard deviation of the annual market returns over the entire sample?
| Less than 5% | ||
| Between 5% and 10% | ||
| Between 10% and 15% | ||
| Between 15% and 20% | ||
| More than 20% |
QUESTION 4
Based on the information in the Portfolio Analysis Problems Data 04 22 23A Excel file, what is the average annual market risk premium over the entire sample?
| Less than 2% | ||
| Between 5% and 10% | ||
| Between 10% and 15% | ||
| Between 15% and 20% | ||
| More than 20% |
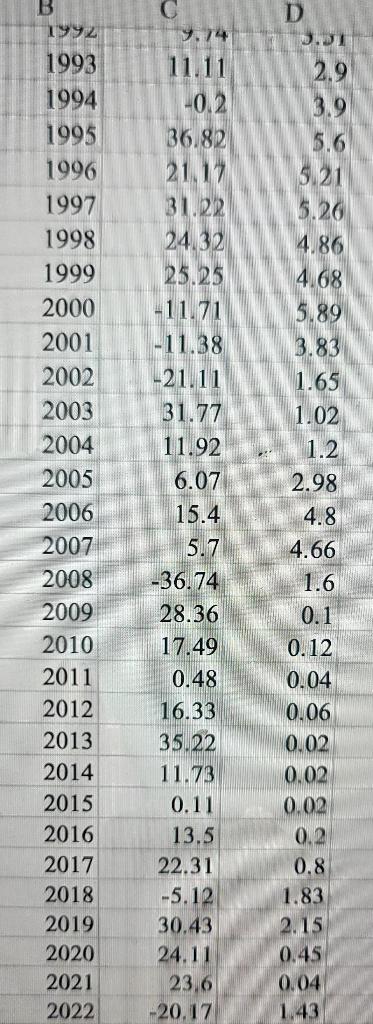
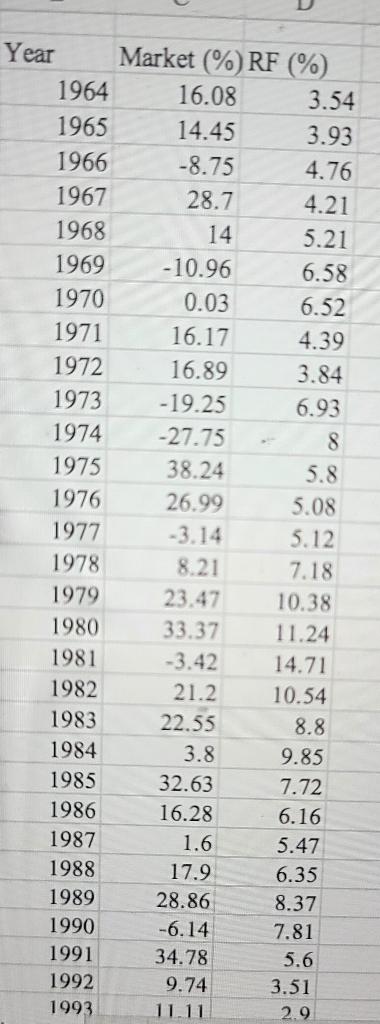
\begin{tabular}{|r|r|r|} \hline B 1992 & C & \multicolumn{1}{l}{ D } \\ \hline 1993 & 11.11 & 3.01 \\ \hline 1994 & -0.2 & 3.9 \\ \hline 1995 & 36.82 & 5.6 \\ 1996 & 21.17 & 5.21 \\ 1997 & 31.22 & 5.26 \\ \hline 1998 & 24.32 & 4.86 \\ \hline 1999 & 25.25 & 4.68 \\ \hline 2000 & -11.71 & 5.89 \\ \hline 2001 & -11.38 & 3.83 \\ \hline 2002 & -21.11 & 1.65 \\ \hline 2003 & 31.77 & 1.02 \\ \hline 2004 & 11.92 & 1.2 \\ \hline 2005 & 6.07 & 2.98 \\ \hline 2006 & 15.4 & 4.8 \\ \hline 2007 & 5.7 & 4.66 \\ \hline 2008 & -36.74 & 1.6 \\ \hline 2009 & 28.36 & 0.1 \\ \hline 2010 & 17.49 & 0.12 \\ \hline 2011 & 0.48 & 0.04 \\ \hline 2012 & 16.33 & 0.06 \\ \hline 2013 & 35.22 & 0.02 \\ \hline 2014 & 11.73 & 0.02 \\ \hline 2015 & 0.11 & 0.02 \\ \hline 2016 & 13.5 & 0.2 \\ \hline 2017 & 22.31 & 0.8 \\ \hline 2018 & -5.12 & 1.83 \\ \hline 2019 & 30.43 & 2.15 \\ \hline 2020 & 24.11 & 0.45 \\ \hline 2021 & 23.6 & 0.04 \\ \hline 2022 & -20.17 & 1.43 \\ \hline \end{tabular} \begin{tabular}{|r|r|r|} \hline Year & Market (\%) RF (\%) \\ \hline 1964 & 16.08 & 3.54 \\ \hline 1965 & 14.45 & 3.93 \\ \hline 1966 & -8.75 & 4.76 \\ \hline 1967 & 28.7 & 4.21 \\ \hline 1968 & 14 & 5.21 \\ \hline 1969 & -10.96 & 6.58 \\ \hline 1970 & 0.03 & 6.52 \\ \hline 1971 & 16.17 & 4.39 \\ \hline 1972 & 16.89 & 3.84 \\ \hline 1973 & -19.25 & 6.93 \\ \hline 1974 & -27.75 & -8 \\ \hline 1975 & 38.24 & 5.8 \\ \hline 1976 & 26.99 & 5.08 \\ \hline 1977 & -3.14 & 5.12 \\ \hline 1978 & 8.21 & 7.18 \\ \hline 1979 & 23.47 & 10.38 \\ \hline 1980 & 33.37 & 11.24 \\ \hline 1981 & -3.42 & 14.71 \\ \hline 1982 & 21.2 & 10.54 \\ \hline 1983 & 22.55 & 8.8 \\ \hline 1984 & 3.8 & 9.85 \\ \hline 1985 & 32.63 & 7.72 \\ \hline 1986 & 16.28 & 6.16 \\ \hline 1987 & 1.6 & 5.47 \\ \hline 1988 & 17.9 & 6.35 \\ \hline 1989 & 28.86 & 8.37 \\ \hline 1990 & -6.14 & 7.81 \\ \hline 1991 & 34.78 & 5.6 \\ \hline 1992 & 9.74 & 3.51 \\ \hline 1993 & 11.11 & 2.9 \\ \hline \end{tabular}
Step by Step Solution
There are 3 Steps involved in it

Get step-by-step solutions from verified subject matter experts