

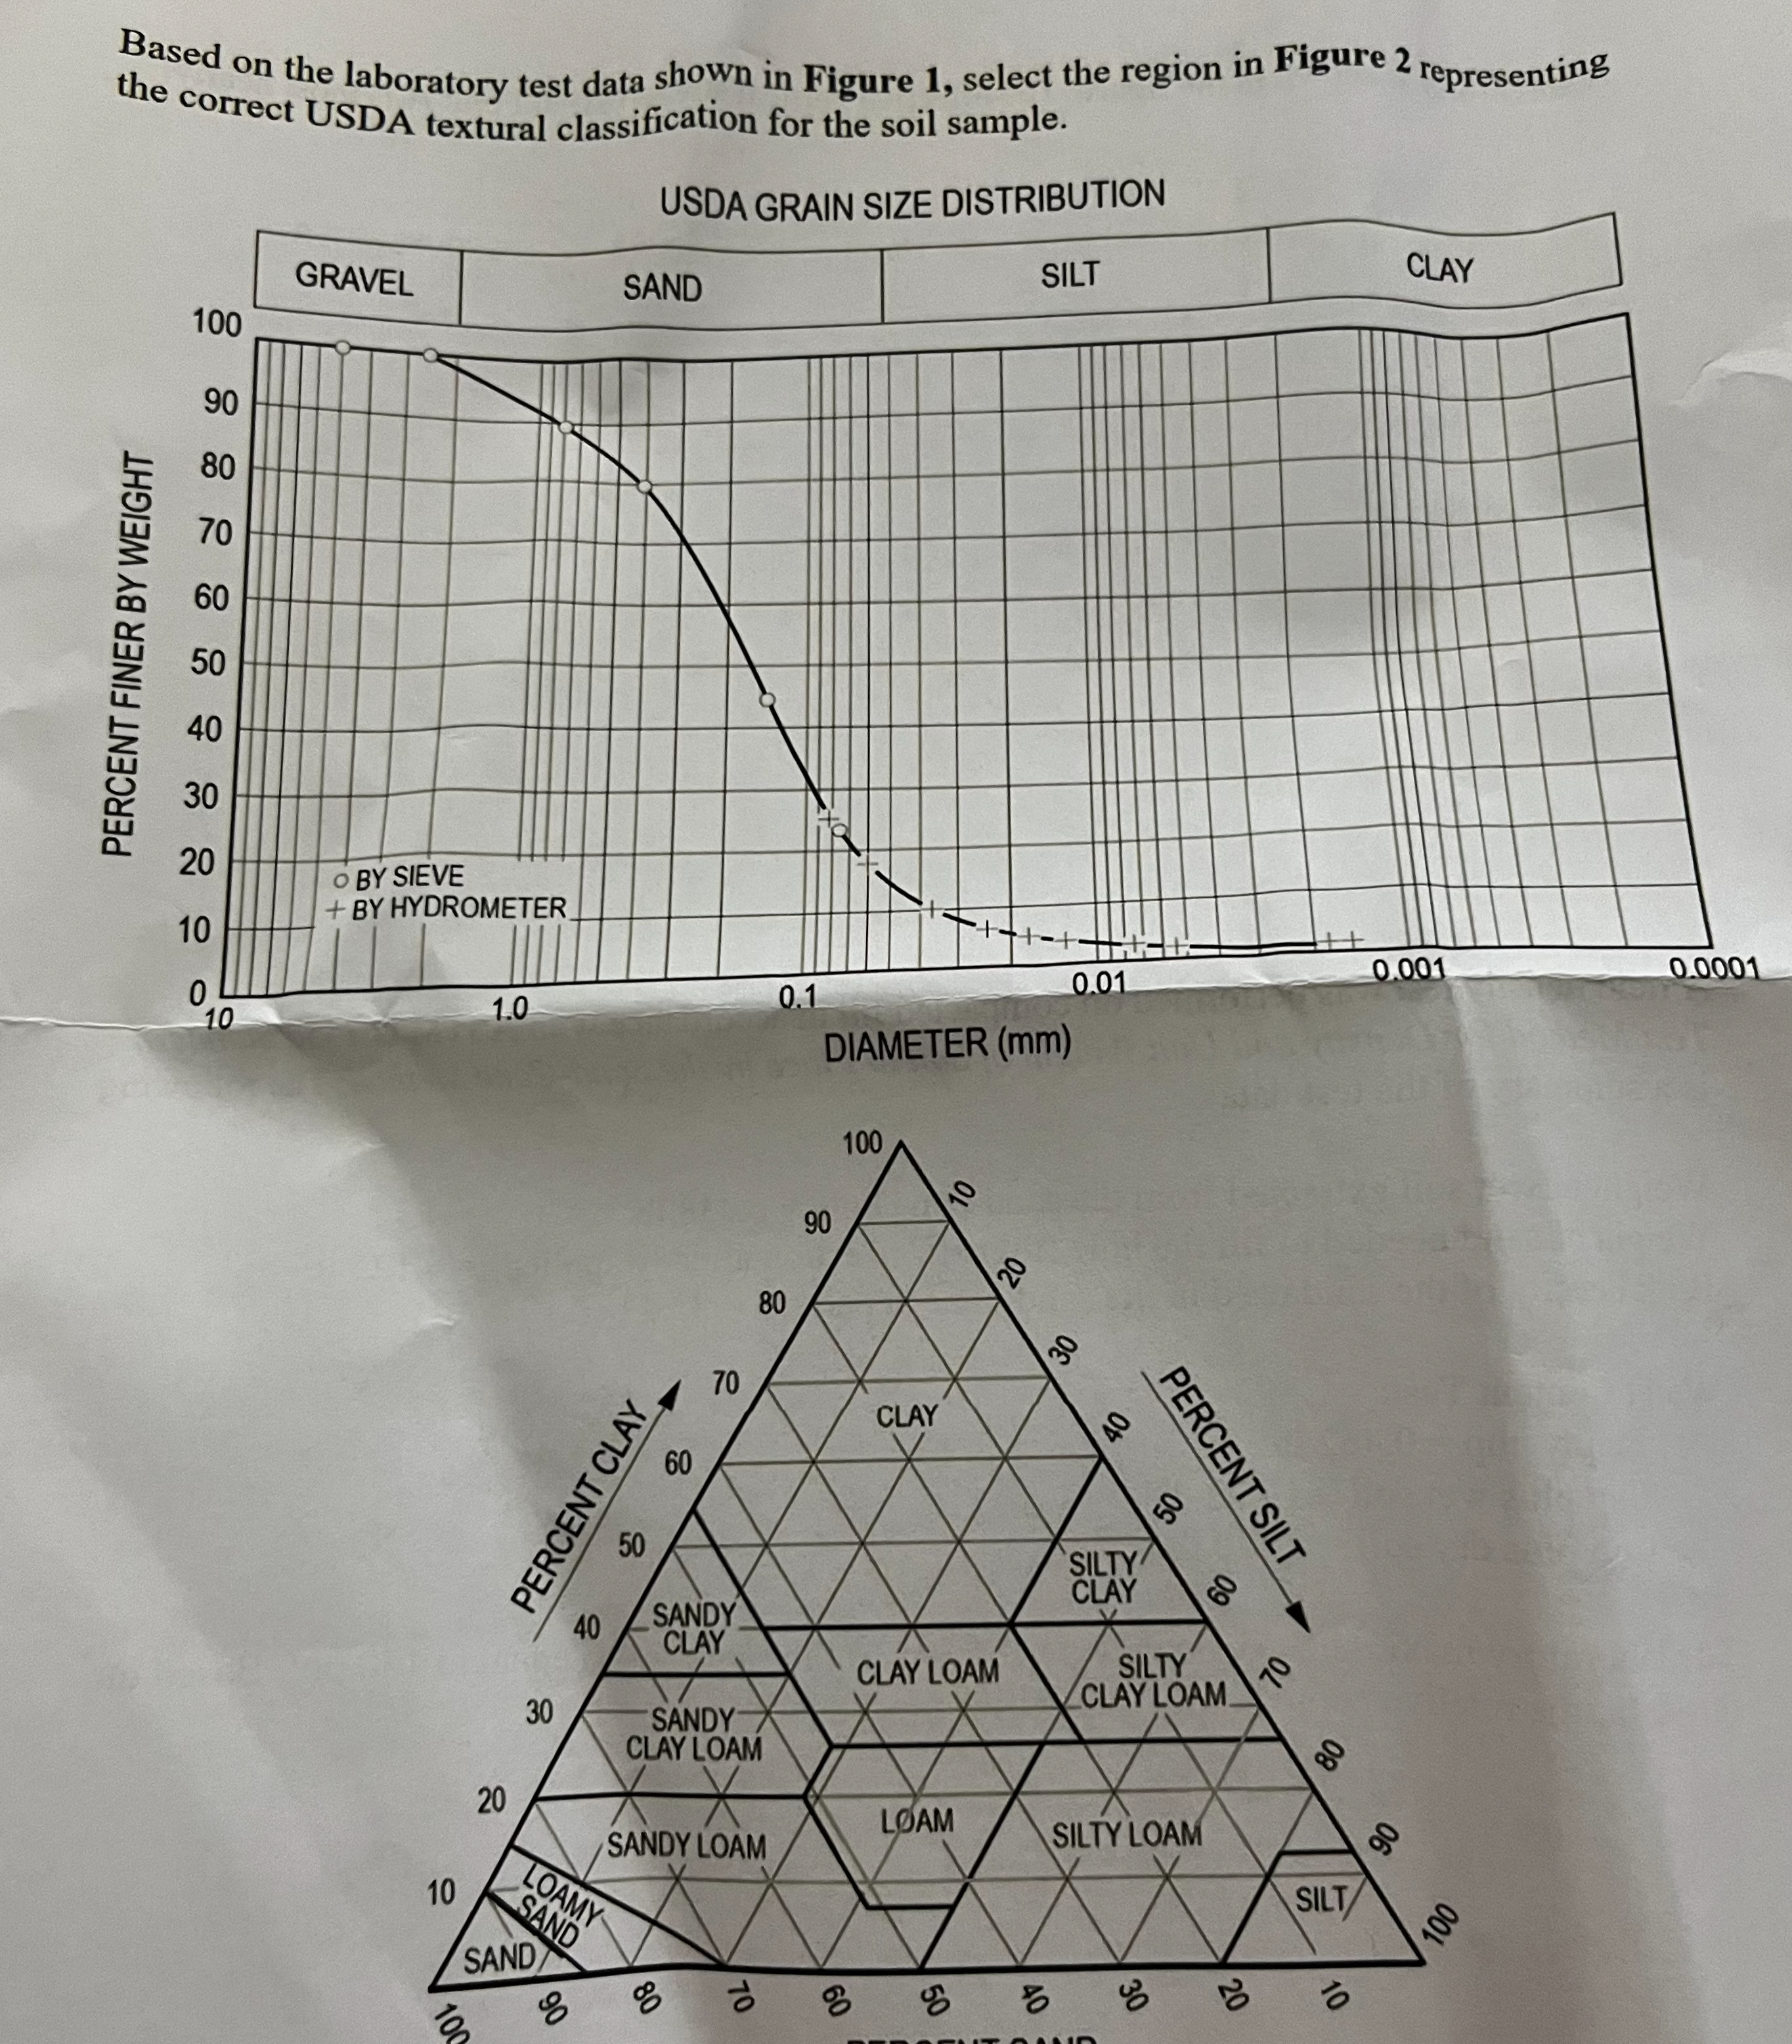
Question: Based on the laboratory test data shown in Figure 1 , select the region in Figure 2 representing the correct USDA texural classification for the
Based on the laboratory test data shown in Figure select the region in Figure representing the correct USDA texural classification for the soil sample.
Step by Step Solution
There are 3 Steps involved in it
1 Expert Approved Answer
Step: 1 Unlock

Question Has Been Solved by an Expert!
Get step-by-step solutions from verified subject matter experts
Step: 2 Unlock
Step: 3 Unlock