

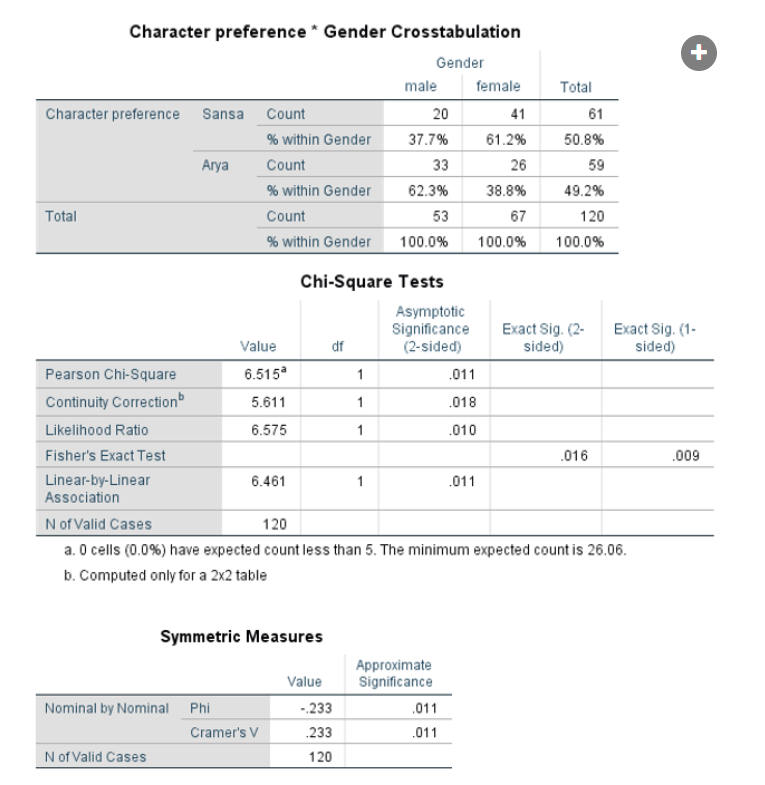
Question: Based on the output, choose the option that most accurately describes the findings.There was a moderate association between character preference and gender (females liked Arya
Based on the output, choose the option that most accurately describes the findings.There was a moderate association between character preference and gender (females liked Arya better, whereas males liked Sansa better)There was no association between character preference and genderThere was a moderate association between character preference and gender (females liked Sansa better, whereas males liked Arya better)There was a strong association between character preference and gender (females liked Sansa better, whereas males liked Arya better)
Step by Step Solution
There are 3 Steps involved in it
1 Expert Approved Answer
Step: 1 Unlock

Question Has Been Solved by an Expert!
Get step-by-step solutions from verified subject matter experts
Step: 2 Unlock
Step: 3 Unlock