

Question: Based on the result of data analysis, propose an optimal design (the best value for each design variable). To explore the optimal design, you can
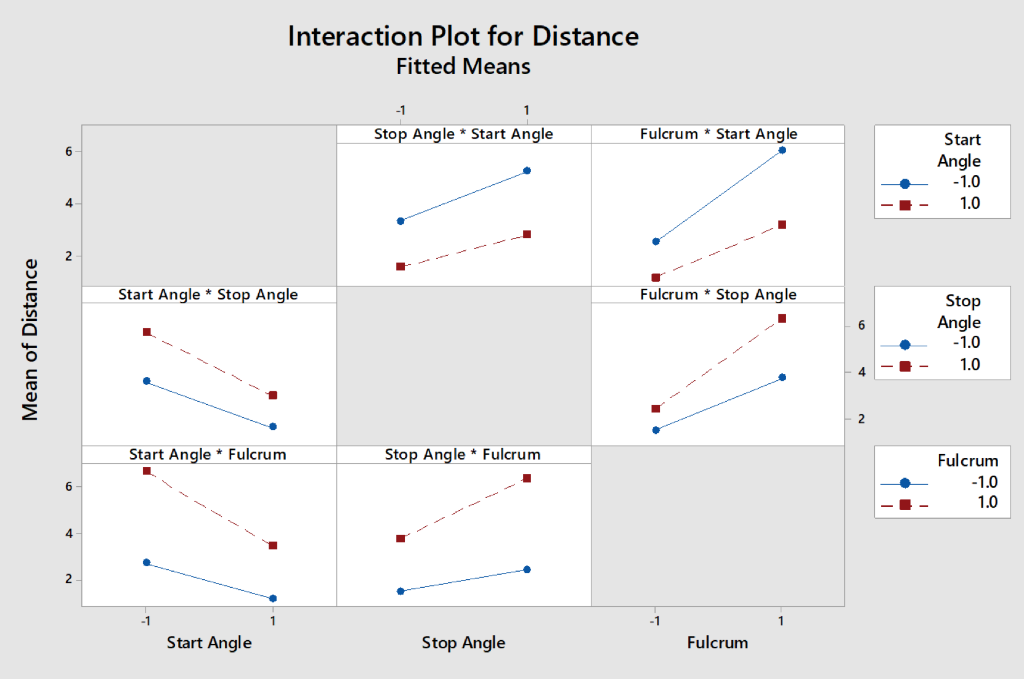 Based on the result of data analysis, propose an optimal design (the best value for each design variable). To explore the optimal design, you can either add a mid-level value to the critical design variables, or modify the problem formulation by adding one more design variable.
Step by Step Solution
There are 3 Steps involved in it
1 Expert Approved Answer
Step: 1 Unlock

Question Has Been Solved by an Expert!
Get step-by-step solutions from verified subject matter experts
Step: 2 Unlock
Step: 3 Unlock