

Question: Based on the sample data in the frequency distribution shown to the right, conduct a test to determine whether the population from which the
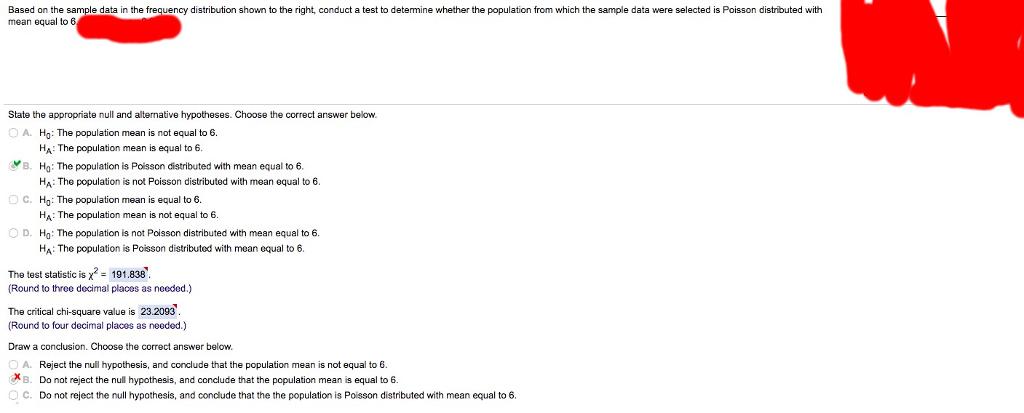
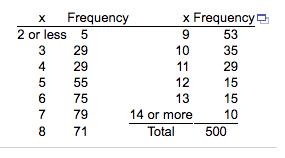
Based on the sample data in the frequency distribution shown to the right, conduct a test to determine whether the population from which the sample data were selected is Poisson distributed with mean equal to 6 State the appropriate null and alternative hypotheses. Choose the correct answer below. OA. Ho: The population mean is not equal to 6. HA: The population mean is equal to 6. B. Ho: The population is Poisson distributed with mean equal to 6. HA: The population is not Poisson distributed with mean equal to 6. C. Ho: The population mean is equal to 6. HA: The population mean is not equal to 6. OD. Hn: The population is not Poisson distributed with mean equal to 6. HA: The population is Poisson distributed with mean equal to 6. The test statistic is x = 191.838. (Round to three decimal places as needed.) The critical chi-square value is 23.2093. (Round to four decimal places as needed.). Draw a conclusion. Choose the correct answer below. A. Reject the null hypothesis, and conclude that the population mean is not equal to 6. B. Do not reject the null hypothesis, and conclude that the population mean is equal to 6. OC. Do not reject the null hypothesis, and conclude that the the population is Poisson distributed with mean equal to 6. Test using = 0.05. X 2 or less 345678 Frequency 5 29 29 55 75 79 71 x Frequency 9 10 11 12 13 14 or more Total 53 35 29 15 15 10 500
Step by Step Solution
3.49 Rating (166 Votes )
There are 3 Steps involved in it
Chisquare test for goodness of fit is suitable test for the given data From the ... View full answer

Get step-by-step solutions from verified subject matter experts