

Question: Based on the size distribution data obtained from a size classifier, the following fractional recovery values were determined: 1. Based on the size distribution data
Based on the size distribution data obtained from a size classifier, the following fractional recovery values were determined:
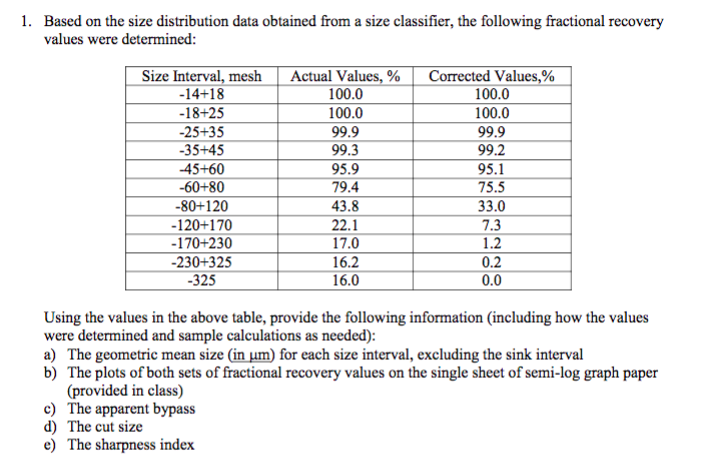
1. Based on the size distribution data obtained from a size classifier, the following fractional recovery values were determined: , mesh Corrected Values,% 100.0 100.0 99.9 99.2 95.1 75.5 33.0 7.3 1.2 0.2 0.0 Size Inte 14+18 -18+25 25+35 35+45 45+60 60+80 -80+120 -120+170 170+230 -230+325 -325 | Actual Values, % | 100.0 100.0 99.9 99.3 95.9 79.4 43.8 22.1 17.0 16.2 16.0 Using the values in the above table, provide the following information (including how the values were determined and sample calculations as needed) a) The geometric mean size (in um) for each size interval, excluding the sink interval b) The plots of both sets of fractional recovery values on the single sheet of semi-log graph paper (provided in class) c) The apparent bypass d) The cut size e) The sharpness index 1. Based on the size distribution data obtained from a size classifier, the following fractional recovery values were determined: , mesh Corrected Values,% 100.0 100.0 99.9 99.2 95.1 75.5 33.0 7.3 1.2 0.2 0.0 Size Inte 14+18 -18+25 25+35 35+45 45+60 60+80 -80+120 -120+170 170+230 -230+325 -325 | Actual Values, % | 100.0 100.0 99.9 99.3 95.9 79.4 43.8 22.1 17.0 16.2 16.0 Using the values in the above table, provide the following information (including how the values were determined and sample calculations as needed) a) The geometric mean size (in um) for each size interval, excluding the sink interval b) The plots of both sets of fractional recovery values on the single sheet of semi-log graph paper (provided in class) c) The apparent bypass d) The cut size e) The sharpness index
Step by Step Solution
There are 3 Steps involved in it

Get step-by-step solutions from verified subject matter experts