

Question: Based on the table and graph, explain in 100-200 words how the country's rate of GPD growth has compared to its debt growth over time
Based on the table and graph, explain in 100-200 words how the country's rate of GPD growth has compared to its debt growth over time and what the implication is for the debt/gdp ratio.
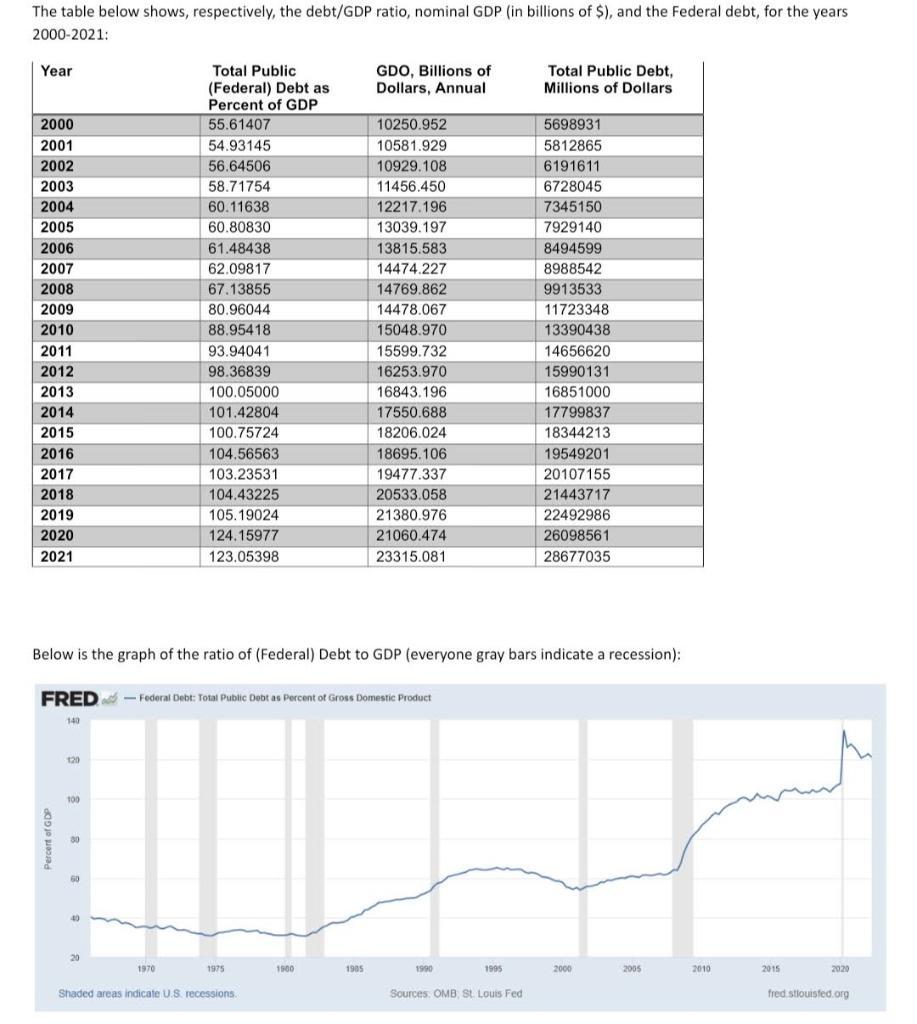
The table below shows, respectively, the debt/GDP ratio, nominal GDP (in billions of \$), and the Federal debt, for the years 2000-2021: Below is the graph of the ratio of (Federal) Debt to GDP (everyone gray bars indicate a recession)
Step by Step Solution
There are 3 Steps involved in it
1 Expert Approved Answer
Step: 1 Unlock

Question Has Been Solved by an Expert!
Get step-by-step solutions from verified subject matter experts
Step: 2 Unlock
Step: 3 Unlock