

Question: Based on the tables and graphs below, interpret and report the results. You need to identify the test, discuss the assumption of normality only, follow
Based on the tables and graphs below, interpret and report the results. You need to identify the test, discuss the assumption of normality only, follow the decision map steps for interpretation, and then report the results in an academic style.
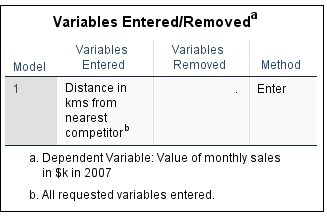
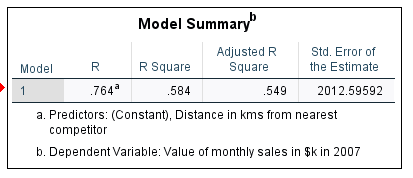


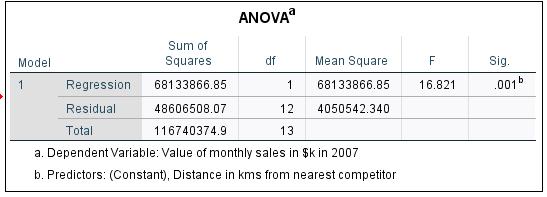
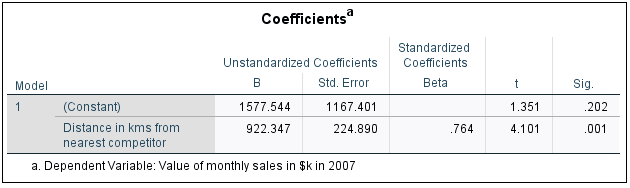
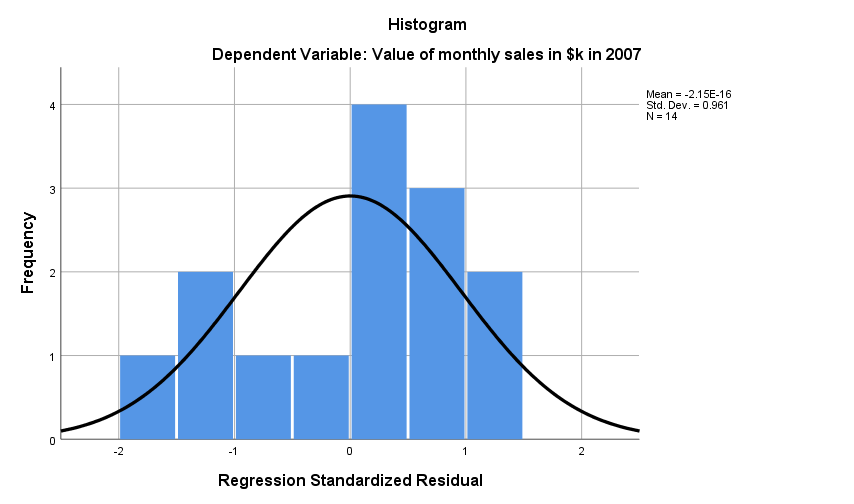
Variables Entered/Removed Variables Variables Model Entered Removed Method Distance in Enter kms from nearest competitor" a. Dependent Variable: Value of monthly sales in $k in 2007 b. All requested variables entered.Model Summary' Adjusted R Std. Error of Model R R Square Square the Estimate .764 .584 .549 2012.59592 a. Predictors: (Constant), Distance in kms from nearest competitor b. Dependent Variable: Value of monthly sales in $k in 2007ANOVA" Sum of Model Squares df Mean Square F Sig. Regression 68133866.85 68133866.85 16.821 001 Residual 48606508.07 12 4050542.340 Total 116740374.9 13 a. Dependent Variable: Value of monthly sales in $k in 2007 b. Predictors: (Constant), Distance in kms from nearest competitorCoefficients" Standardized Unstandardized Coefficients Coefficients Model B Std. Error Beta Sig. (Constant) 1577.544 1167.401 1.351 202 Distance in kms from 922.347 224.890 .764 4.101 001 nearest competitor a. Dependent Variable: Value of monthly sales in $k in 2007Histogram Dependent Variable: Value of monthly sales in $k in 2007 Mean = -2.15E-16 4 Std. Dev. = 0.961 N = 14 3 Frequency 2 -2 -1 0 1 Regression Standardized Residual
Step by Step Solution
There are 3 Steps involved in it

Get step-by-step solutions from verified subject matter experts