

Question: Based on the tables and graphs below, interpret and report the results. You need to identify the test, discuss the assumptions. Follow the decision steps
Based on the tables and graphs below, interpret and report the results. You need to identify the test, discuss the assumptions. Follow the decision steps for interpretation, and then report the results in an academic style. Note that if any of the assumptions have been violated, you need to report it and continue as if it has not been violated.
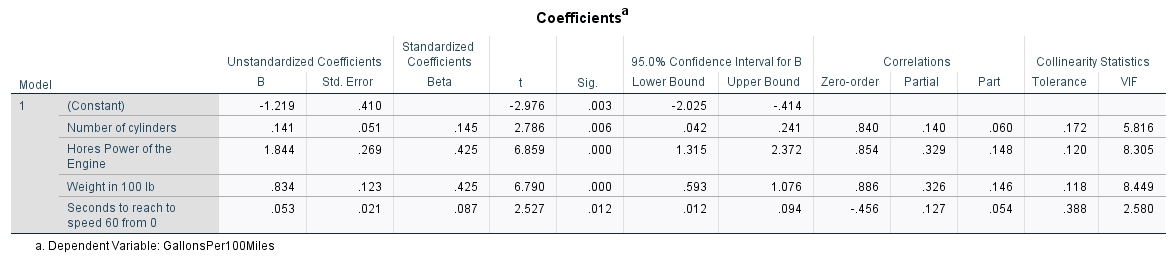
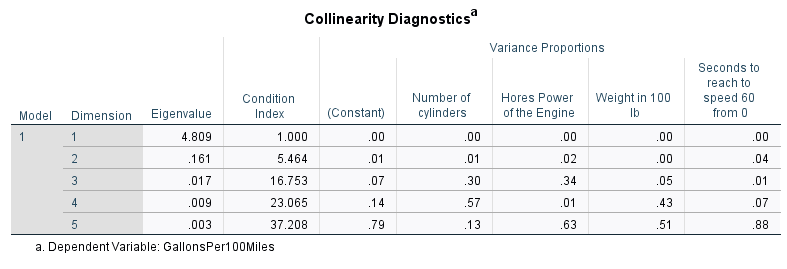
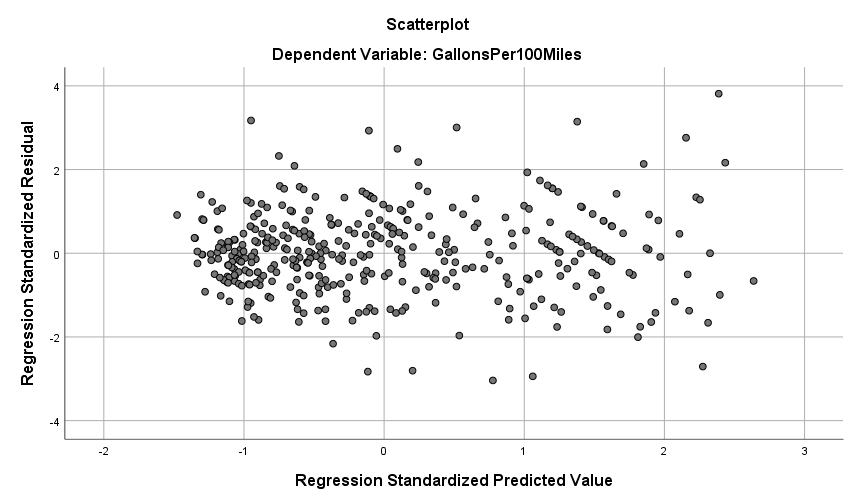
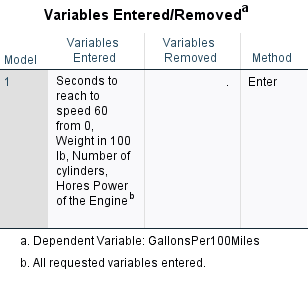
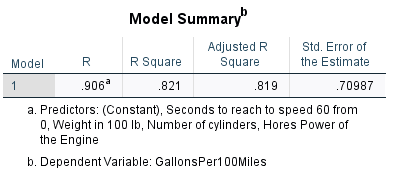
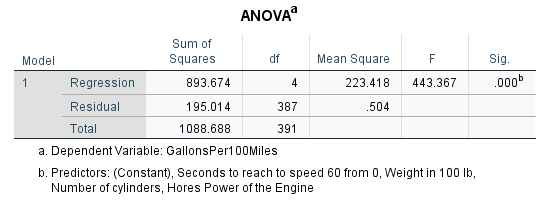
Coefficients Standardized Unstandardized Coefficients Coefficients 95.0% Confidence Interval for B Model B Correlations Std. Error Collinearity Statistics Beta Sig Lower Bound Upper Bound Zero-order Partial (Constant) Part Tolerance VIF -1.219 410 -2.976 003 -2.025 -.414 Number of cylinders 141 051 145 2.786 006 042 Hores Power of the 241 840 140 060 1.844 172 5.816 269 425 6.859 Engine 000 1.315 2.372 854 329 .148 120 8.305 Weight in 100 lb .834 123 425 6.790 000 593 1.076 .886 Seconds to reach to 326 146 .053 .118 8.449 021 087 speed 60 from 0 2.527 012 012 094 -.456 .127 054 388 2.580 a. Dependent Variable: GallonsPer1 00MilesCollinearity Diagnostics Variance Proportions Seconds to reach to Condition Number of Hores Power Weight in 100 Model Dimension Eigenvalue speed 60 Index (Constant) cylinders of the Engine Ib from 0 1 4.809 1.000 00 00 00 00 00 161 5.464 01 01 02 00 04 3 017 16.753 07 .30 .34 05 01 009 23.065 .14 57 01 43 07 003 37.208 .79 13 63 .51 88 a. Dependent Variable: GallonsPer1 00Miles\fScatterplot Dependent Variable: GallonsPer100Miles 2 9000 0 CO Regression Standardized Residual 0 O -2 -4 -2 -1 0 2 3 Regression Standardized Predicted ValueVariables Entered/Removed" Variables Variables Model Entered Removed Method Seconds to Enter reach to speed 60 from 0, Weight in 100 lb, Number of cylinders, Hores Power of the Engine a. Dependent Variable: GallonsPer1 00Miles b. All requested variables entered.Model Summary Adjusted R Std. Error of Model R R Square Square the Estimate .906 821 819 .70987 a. Predictors: (Constant), Seconds to reach to speed 60 from 0, Weight in 100 lb, Number of cylinders, Hores Power of the Engine b. Dependent Variable: GallonsPer100MilesANOVA" Sum of Model Squares df Mean Square F Sig. Regression 893.674 4 223.418 443.367 ooo Residual 195.014 387 .504 Total 1088.688 391 a. Dependent Variable: GallonsPer1 00Miles b. Predictors: (Constant), Seconds to reach to speed 60 from 0, Weight in 100 lb, Number of cylinders, Hores Power of the Engine
Step by Step Solution
There are 3 Steps involved in it

Get step-by-step solutions from verified subject matter experts