

Question: BASED ON THE WORK SHOWN BELOW, I NEED HELP WITH THE BOLDED PARTS I DONT KNOW HOW TO DO A MEMO BASED ON THE INFO
BASED ON THE WORK SHOWN BELOW, I NEED HELP WITH THE BOLDED PARTS I DONT KNOW HOW TO DO A MEMO BASED ON THE INFO AT THE BOTTOM
The case asks you to put yourself in the shoes of Susan Jenkins, the CFO of a web applications company called Software Associates. Your boss, software Associates' CEO, Richard Norton, is worried about the variances in the latest financial statements and has asked you to meet with him to discuss these. For purposes of our assignment, we will assume that rather than preparing for a meeting with Mr. Norton, you are preparing a memo to submit to him, addressing his questions.
In the first paragraph of the case, Richard Norton has expressed a very concrete concern: "Why, with higher revenues, is our bottom line less than half of what we had budgeted?" Your assignment for the case is to write Mr. Norton a memo answering this question.
Interspersed throughout the text's case are five "Assignment Questions" each asking you to make a specific analysis. In your memo, you will include each analysis as an "exhibit" after the text of the memo. In the text of your memo, explain for each analysis:
What the purpose of the analysis is
What specific conclusions can be reached from evaluating the analysis
What recommendations can be reached from these conclusions
What additional questions are there that are not answered by the analysis How you would go about answering these questions.
Finally, close your memo with a brief paragraph summarizing your answer to the question: ""Why, with higher revenues, is our bottom line less than half of what we had budgeted?" and with your recommendations on how to improve the situation.
1. Assignment Question: make a variance analysis report based on the information in Exhibit 1.
Would this be sufficient to explain the profit shortfall to Norton at the 8 AM meeting?
| Actual value | Budgeted Value | Variance Amount | Acceptable & unacceptable | |
| Revenues | 3264000 | 3231900 | 32100 | Acceptable |
| Expenses | 2967610 | 2625550 | 342060 | unacceptable |
| Profits | 296390 | 606350 | -309960 | unacceptable |
Actual Revenue (AR) = $3264000
Budgeted Revenue (ER) = $3231900
Total Revenue Variance = AR - ER
$3264000 - $3231900 = $32100
Actual revenue is more than budgeted, so this is a favorable scenario.
Actual Expenses (AE) = $ 29 67610
Budgeted Expenses (EE) = $ 2625550
Total Expense variance = AE - EE
$29 67610 - $26 25550 = $342060
Actual expense is more than the expected expenses, it is an unfavorable scenario.
Actual Profits = $ 296390
Budgeted Profits = $ 606350
Total Profit variance = AP - EP
$296390 - $606350 = ($309960)
Actual profit is way less than budgeted profit, making this an unfavorable scenario.
ANALYSIS
With the information in display 1, we need the fundamental part of expenses and encourage points of interest, which is almost how the two divisions have gone through and earned their cash. So, more than the given data is needed to discover the zone of issue. From the information in Exhibit 1, we can tell there's an increment in cost, but we cannot clarify why the cost has increased. This gives us a course where we must walk to discover the genuine root cause.
2. Assignment Question make a variance analysis report based on the information in Exhibit 2. Quantity/Efficiency Variance = (Actual Quantity - Expected Quantity) * Expected Price Price/Rate Variance = (Actual Price -Expected Price) * Actual Quantity
Quantity/Efficiency Variance = (Actual Quantity - Expected Quantity) * Expected Price Price/Rate Variance = (Actual Price -Expected Price) * Actual Quantity
Revenue variance analysis:
| Actual quantity | Budgeted Quantity | Expected price | Variance amount | Acceptable & unacceptable | |
| Revenue quantity (# of hours) | 39000 | 35910 | 90 | 278100 | A |
| Actual price | Expected price | Actual quantity | Variance amount | A&U | |
| Revenue Rate (hourly Rate0 | 83.69 | 90 | 39000 | -246090 | U |
| Total Revenue | 32010 | A | |||
The actual amount is more than the budgeted amount, so indeed, even though the introductory hourly rate is somewhat lesser than the budgeted hourly rate, the genuine add-up to income has expanded and the fluctuation in income is favorable.
Consultant expense analysis:
| Actual quantity | Budgeted quantity | Expected price | Variance amount | A&U | |
| Consultant expense quantity | 113 | 105 | 1665 | 133200 | U |
| Consultant expense rate | 17956.19469 | 16650 | 113 | 147600 | U |
| Total consultant expense variance | 280800 | U | |||
Per unit cost of specialist expense Number of consultants
Actual per unit cost of expert 2029050 /113 =17,956
Budgeted per unit price of consultant = 1748250 /105 = $16,650
Within the cost situation, the most parameter number of experts and the actual expense
rate of experts both have expanded. So, the company is paying or investing more in
consultants. The change in specialist cost is acceptable.
Total expense analysis: Total expense variance = Consultant expense variance + Operating expense variance
| Actual operating expense | Expected operating expense | Variance | A&U | |
| Operating expense | 938560 | 877300 | 61260 | U |
| Total expense variance | 342060 | U |
The information in this address could be further than the one provided for the primary address. Here, one of the contributing components to the increment in cost is the increase in the number of experts and the expert cost rate. On the other hand, the unacceptable fluctuation within the working cost is more noteworthy than the budgeted or anticipated working cost.
3. Assignment Question make a spending and volume variance analysis of operating expenses based on the additional information supplied in Exhibit 3.
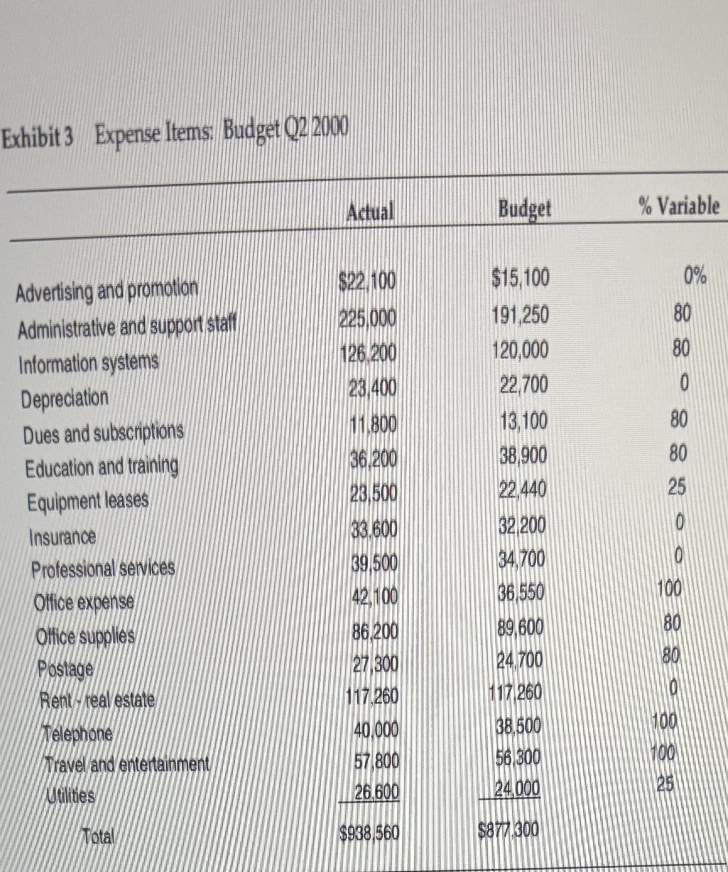
Exhibit 3 Expense Items: Budget ()2 2090 Actual Budget % Variable Advertising and promotion $22,100 $15,100 0% Administrative and support staff 225,000 191,250 80 Information systems 126.200 120,000 80 Depreciation 23 400 22,700 0 Dues and subscriptions 11.800 13,100 80 Education and training 36.200 38,900 80 Equipment leases 23.500 22,440 25 Insurance 33.600 32 200 Professional services 39/500 34,700 10 Office expense 42.100 36,550 100 Office supplies 86.200 89,600 80 Postage 27 300 24 700 80 Rent - real estate 117.260 117 260 10 Telephone 40,000 38,500 109 Travel and entertainment 57 800 56 300 100 Utilities 26,600 124,000 25 Total $938,560 $877.300
Step by Step Solution
There are 3 Steps involved in it

Get step-by-step solutions from verified subject matter experts