

Question: Based on this analysis, explain why whether or not you would include Bajaj Consumer Care Ltd into your company portfolio. K 8.5% 28.79 0.00% 92.4
Based on this analysis, explain why whether or not you would include Bajaj Consumer Care Ltd into your company portfolio.
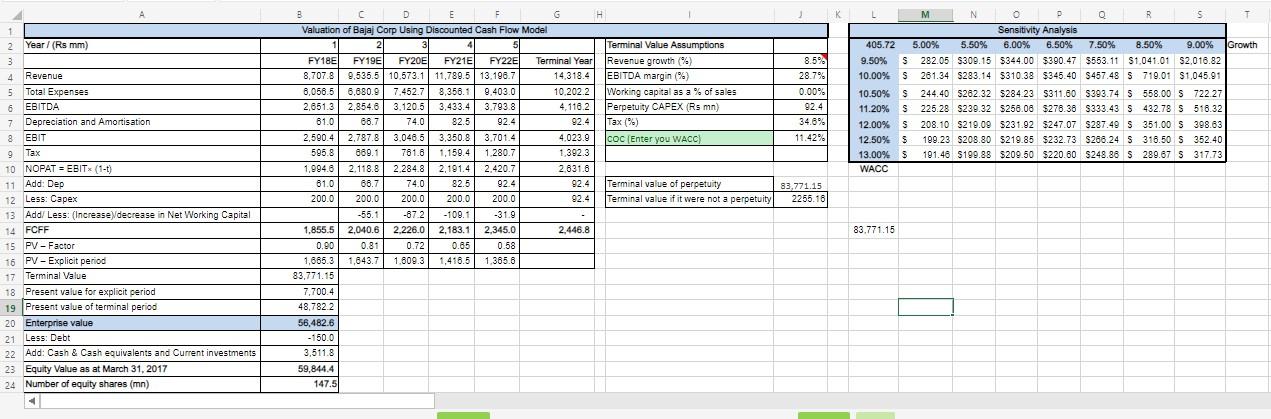
K 8.5% 28.79 0.00% 92.4 34.8% 11.42% L M N o D Q R S T Sensitivity Analysis 405.72 5.00% 5.50% 6.00% 6.50% 7.50% 8.50% 9.00% Growth 9.50% S 282.05 $309.15 $344.00 $390.47 $553.11 $1.041.01 52,018.82 10.00% $ 261.34 $283.14 $310.38 $345.40 $457.48 S 719.01 $1,045.91 10.50% $ 244.40 S282.32 $284.23 $311.80 $393.74 $ 558.00 S 722.27 % S 11.20% S225.28 $239.32 $250.08 $276.36 5333.43 S 432.78 S 516.32 12.00% S 208.10 $219.09 5231.92 $247.07 $287.49 S 351.00 S 398.63 12.50% $ 199.23 $208.80 $219.85 $232.73 $288.24 S 316.50 S 352.40 $ 13.00% $ 191.46 $199.88 $209.50 $220.60 S248.88 $ 289.67 S 317.73 WACC B C D E F G H H Valuation of Bajaj Corp Using Discounted Cash Flow Model 2 4 Terminal Value Assumptions FY18E FY19E FY20E FY21E FY22E Terminal Year Revenue growth (?) 8,707.8 9,535.5 10.573.1 11,789.5 13.196.7 14.318.4 EBITDA margin (%) 6,056.5 6,680.9 7,452.7 8,356.1 9.403.0 10.202.2 Working capital as a % of sales 2,651.3 2,854.8 3.120.5 3,433.4 3.793.8 4,116.2 Perpetuity CAPEX (Rs mn) 81.0 86.7 74.0 82.5 92.4 92.4 Tax (%) 2,590.4 2,787.8 3.048.5 3.350.8 3.7014 4,023.9 COC (Enter you WACC) 595.8 880.1 781.8 1.159.4 1.280.7 1,392.3 1,994.82.118.8 2.284.8 2,191.4 2.420.7 2.631.6 81.0 88.7 74.0 82.5 92.4 92.4 821 Terminal value of perpetuity 2000 200.0 200.0 200.0 200.0 92.4 Terminal value if it were not a perpetuity -55.1 -872 -109.1 -31.9 1.855.5 2,040.6 2.226.0 2.183.1 2,345.0 2.446.8 0.90 0.81 0.72 0.65 0.58 1,665.3 1,643.7 1.809.3 1,416.5 1.365.6 83,771.15 7,700.4 48.782.2 56,482.6 200 - 150.0 3,511.8 59,844.4 147.5 2 Year / (Rs mm) 3 4 Revenue 5 Total Expenses 6 EBITDA 7 Depreciation and Amortisation 8 EBIT Tax 9 9 lax 10 NOPAT = EBIT (1-1) 11 Add: Dep 12 Less: Capex 13 Add/ Less: (Increase decrease in Net Working Capital 14 FCFF 14 or 15 PV-Factor 16 PV - Explicit period 17 Terminal Value 18 Present value for explicit period 19 Present value of terminal period 20 Enterprise value 21 Less: Debt 22 Add: Cash & Cash equivalents and Current investments 23 Equity Value as at March 31, 2017 24 Number of equity shares (mn) 83,771.15 2255.16 83.771.15 K 8.5% 28.79 0.00% 92.4 34.8% 11.42% L M N o D Q R S T Sensitivity Analysis 405.72 5.00% 5.50% 6.00% 6.50% 7.50% 8.50% 9.00% Growth 9.50% S 282.05 $309.15 $344.00 $390.47 $553.11 $1.041.01 52,018.82 10.00% $ 261.34 $283.14 $310.38 $345.40 $457.48 S 719.01 $1,045.91 10.50% $ 244.40 S282.32 $284.23 $311.80 $393.74 $ 558.00 S 722.27 % S 11.20% S225.28 $239.32 $250.08 $276.36 5333.43 S 432.78 S 516.32 12.00% S 208.10 $219.09 5231.92 $247.07 $287.49 S 351.00 S 398.63 12.50% $ 199.23 $208.80 $219.85 $232.73 $288.24 S 316.50 S 352.40 $ 13.00% $ 191.46 $199.88 $209.50 $220.60 S248.88 $ 289.67 S 317.73 WACC B C D E F G H H Valuation of Bajaj Corp Using Discounted Cash Flow Model 2 4 Terminal Value Assumptions FY18E FY19E FY20E FY21E FY22E Terminal Year Revenue growth (?) 8,707.8 9,535.5 10.573.1 11,789.5 13.196.7 14.318.4 EBITDA margin (%) 6,056.5 6,680.9 7,452.7 8,356.1 9.403.0 10.202.2 Working capital as a % of sales 2,651.3 2,854.8 3.120.5 3,433.4 3.793.8 4,116.2 Perpetuity CAPEX (Rs mn) 81.0 86.7 74.0 82.5 92.4 92.4 Tax (%) 2,590.4 2,787.8 3.048.5 3.350.8 3.7014 4,023.9 COC (Enter you WACC) 595.8 880.1 781.8 1.159.4 1.280.7 1,392.3 1,994.82.118.8 2.284.8 2,191.4 2.420.7 2.631.6 81.0 88.7 74.0 82.5 92.4 92.4 821 Terminal value of perpetuity 2000 200.0 200.0 200.0 200.0 92.4 Terminal value if it were not a perpetuity -55.1 -872 -109.1 -31.9 1.855.5 2,040.6 2.226.0 2.183.1 2,345.0 2.446.8 0.90 0.81 0.72 0.65 0.58 1,665.3 1,643.7 1.809.3 1,416.5 1.365.6 83,771.15 7,700.4 48.782.2 56,482.6 200 - 150.0 3,511.8 59,844.4 147.5 2 Year / (Rs mm) 3 4 Revenue 5 Total Expenses 6 EBITDA 7 Depreciation and Amortisation 8 EBIT Tax 9 9 lax 10 NOPAT = EBIT (1-1) 11 Add: Dep 12 Less: Capex 13 Add/ Less: (Increase decrease in Net Working Capital 14 FCFF 14 or 15 PV-Factor 16 PV - Explicit period 17 Terminal Value 18 Present value for explicit period 19 Present value of terminal period 20 Enterprise value 21 Less: Debt 22 Add: Cash & Cash equivalents and Current investments 23 Equity Value as at March 31, 2017 24 Number of equity shares (mn) 83,771.15 2255.16 83.771.15
Step by Step Solution
There are 3 Steps involved in it

Get step-by-step solutions from verified subject matter experts