

Question: based on this data what is the best analysis expelnation : Hypothesis:To examine the effect of the gender onTECHNOLOGY ACCEPTANCE AutoSave ( Off) H CHI
based on this data what is the best analysis expelnation :
Hypothesis:To examine the effect of the gender onTECHNOLOGY ACCEPTANCE
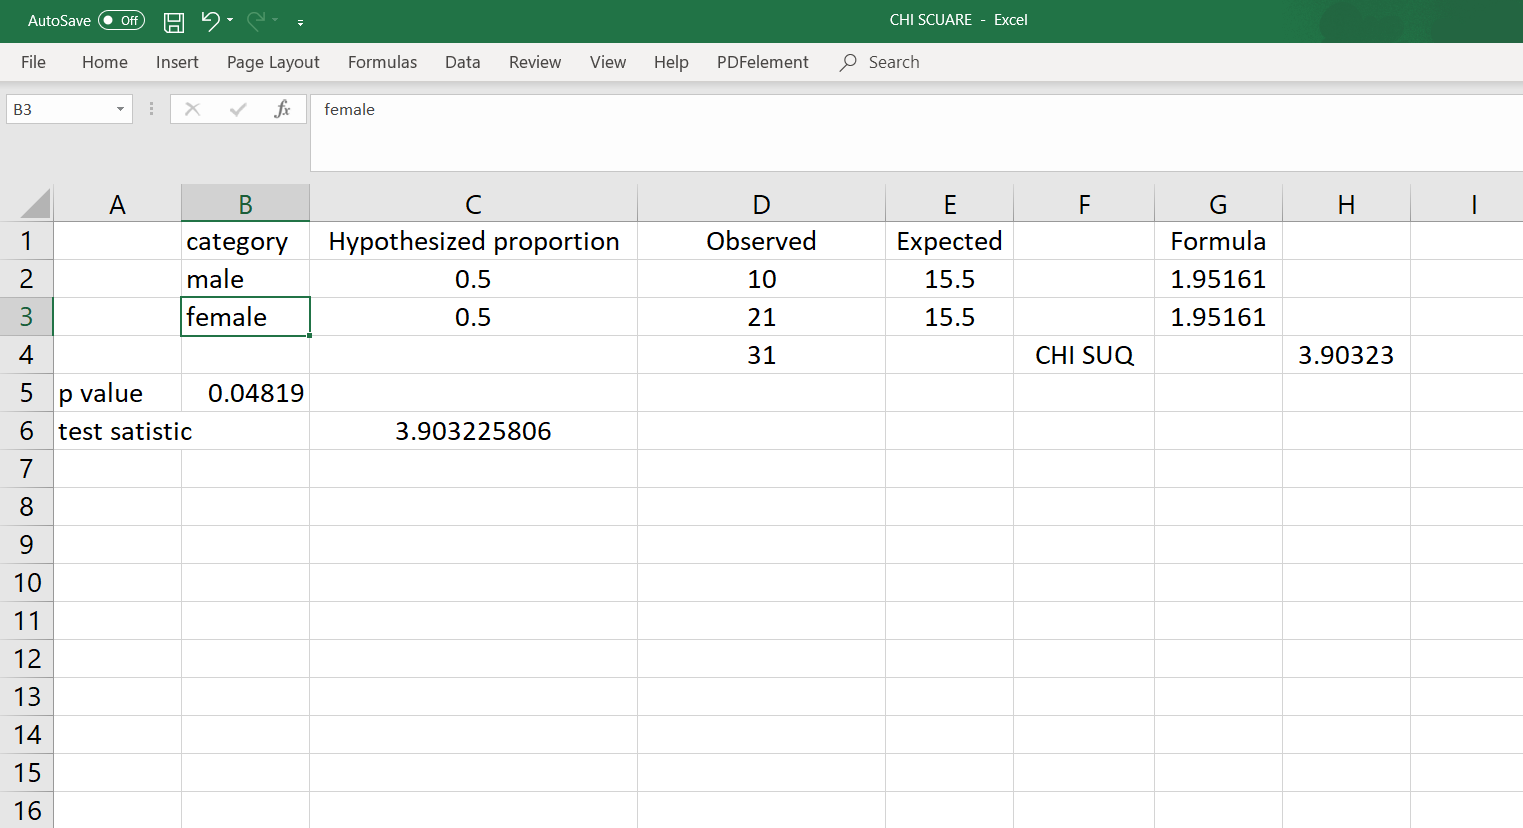
AutoSave ( Off) H CHI SCUARE - Excel File Home Insert Page Layout Formulas Data Review View Help PDFelement Search B3 X V fx female A B C D E F G H category Hypothesized proportion - Observed Expected Formula 2 male 0.5 10 15.5 1.95161 3 female 0.5 21 15.5 1.95161 4 31 CHI SUQ 5 p value 3.90323 0.04819 6 test satistic 3.903225806 7 8 9 10 11 12 13 14 15 16
Step by Step Solution
There are 3 Steps involved in it
1 Expert Approved Answer
Step: 1 Unlock

Question Has Been Solved by an Expert!
Get step-by-step solutions from verified subject matter experts
Step: 2 Unlock
Step: 3 Unlock