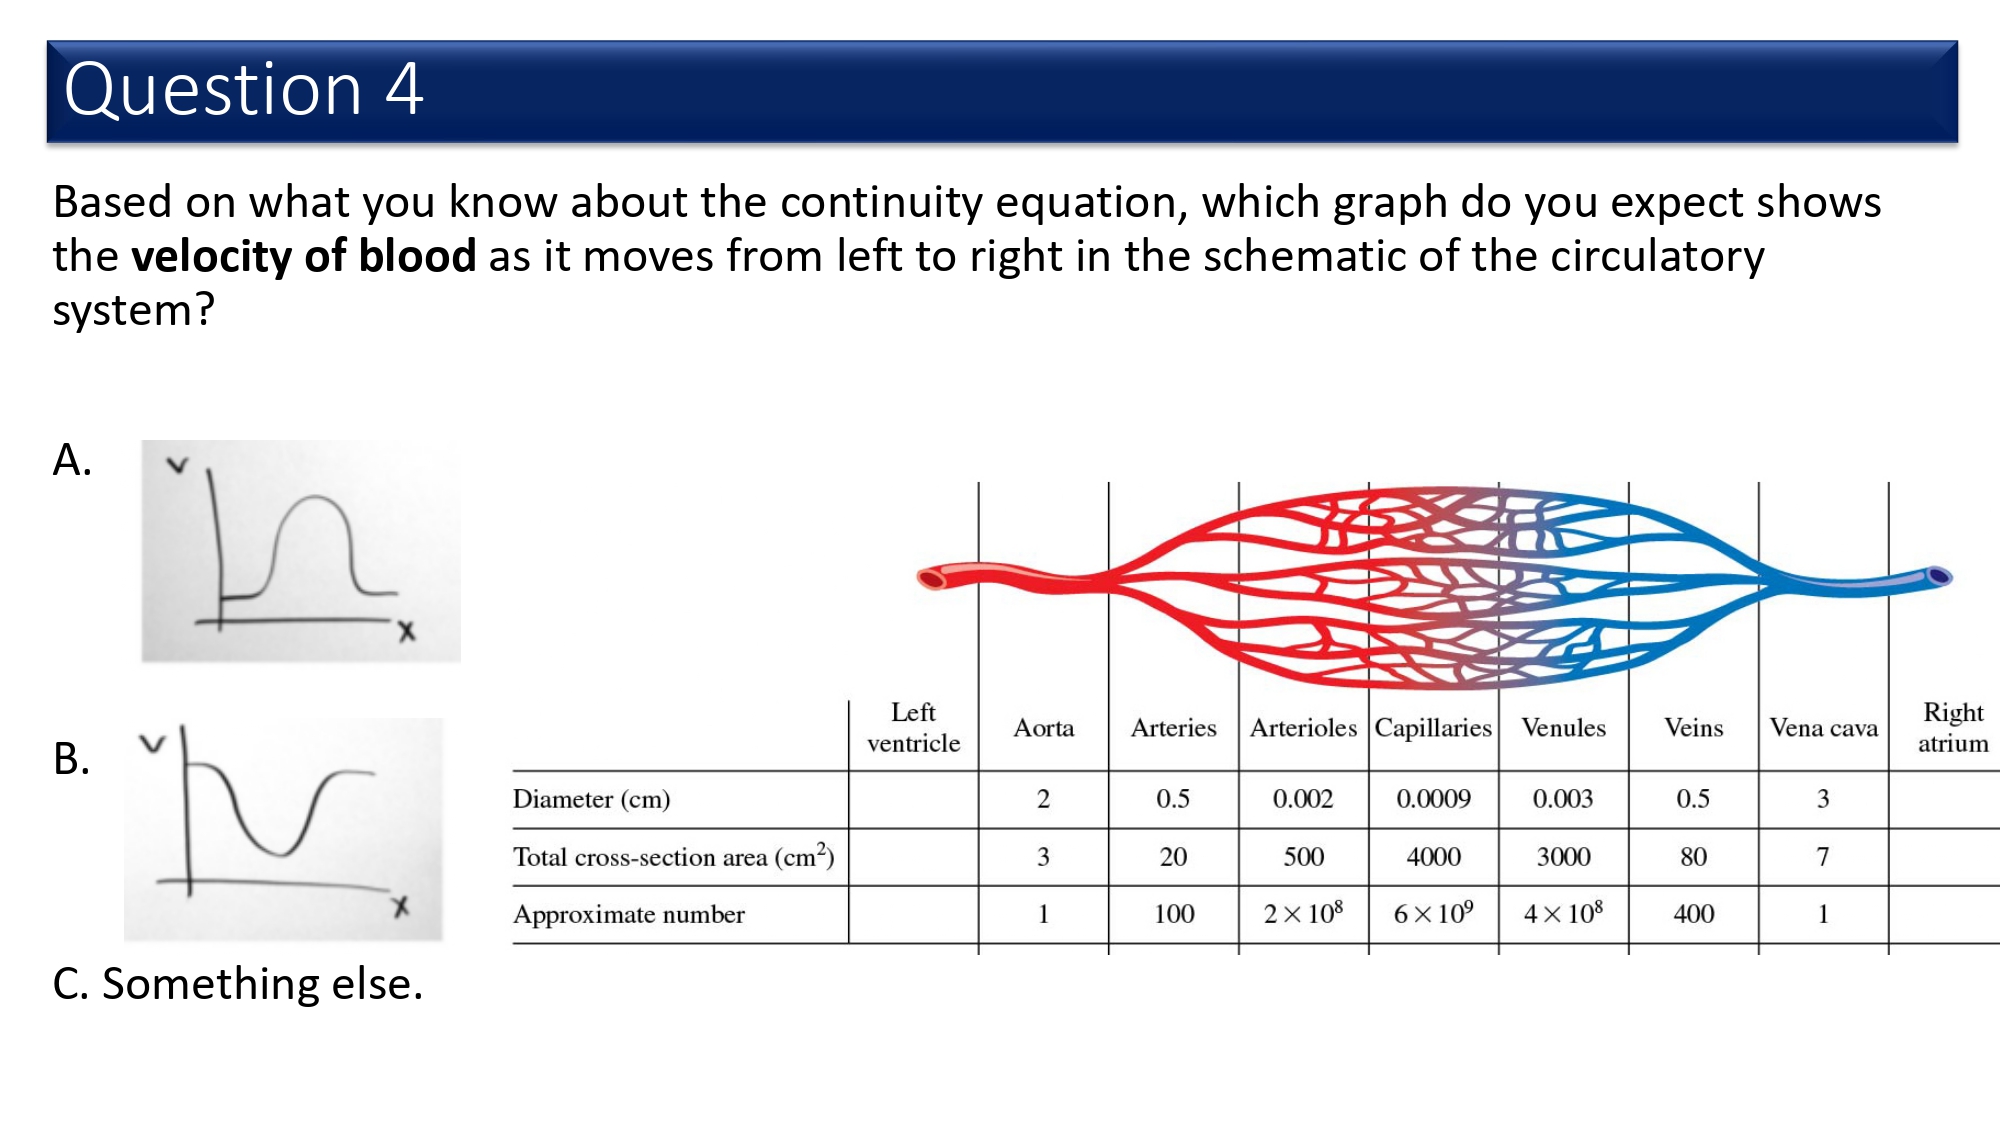
Question: Based on what you know about the continuity equation, which graph do you expect shows the velocity of blood as it moves from left to

Based on what you know about the continuityBased on what you know about the continuityBased on what you know about the continuity
Based on what you know about the continuity equation, which graph do you expect shows the velocity of blood as it moves from left to right in the schematic of the circulatory system? A. % C. Something else. Left ventricle Capillaries Venules Vena cava Right atrium Diameter (cm) Total cross-section area (cm?) 0.0009 0.003 Approximate number Based on the Bernoulli principle, which graph do you expect shows the pressure of blood as it moves from left to right? Left Right ventricle atrium Arteries Diameter (cm) | 0.5 Total cross-section area (cm?) | 3 20 500 | Approximate number C. Something else Suppose the cross-sectional area of an artery is reduced to 84% of its original diameter by the buildup of plaque deposits. By what factor would the pressure difference need to change maintain the original blood flow Increase by a factor of 4 Increase by a factor of 2 Increase by a factor of 1.2 Decrease by a factor of 0.84 mR* Ap 990 F >

Step by Step Solution

There are 3 Steps involved in it

1 Expert Approved Answer
Step: 1 Unlock blur-text-image
Question Has Been Solved by an Expert!

Get step-by-step solutions from verified subject matter experts

Step: 2 Unlock
Step: 3 Unlock

Students Have Also Explored These Related Accounting Questions!