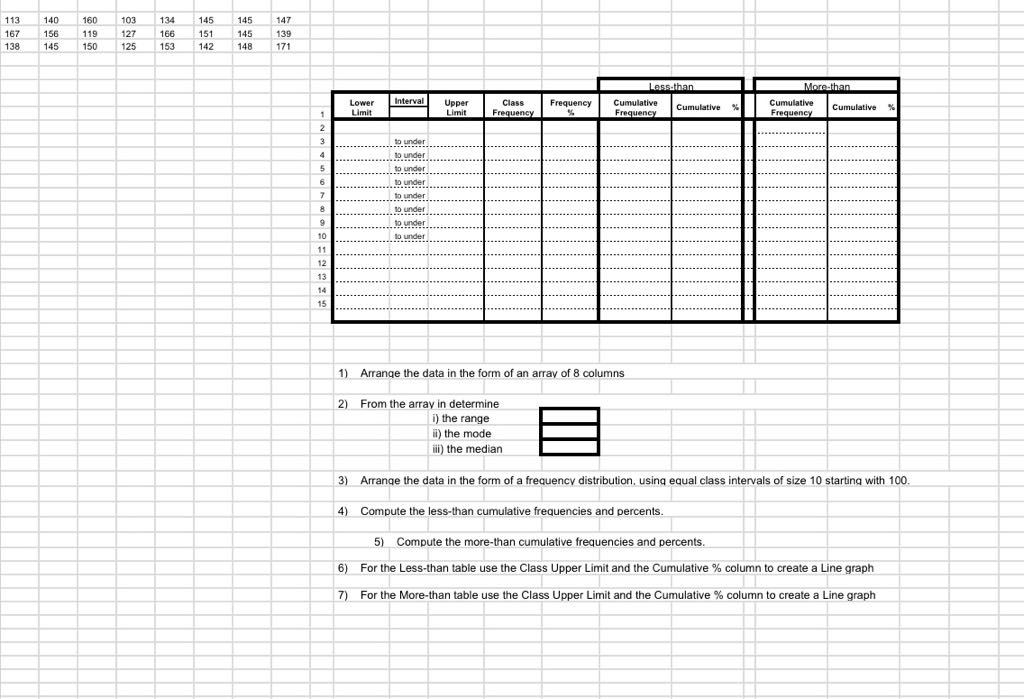
Question: can you solve this statistics in step by step for me 113 140 160 103 134 145 145 147 167 156 119 127 166 151

can you solve this statistics in step by step for me

can you solve this statistics in step by step for
113 140 160 103 134 145 145 147 167 156 119 127 166 151 145 139 138 145 150 125 153 142 148 171 Lower Interval Upper Class % Limit Limit Frequency .19.under... .18.unee!.. Be.under. 1..under .18 under 45 1) Arrange the data in the form of an array of 8 columns 2) From the array in determine i) the range ") the mode ili) the median 3) Arrange the data in the form of a frequency distribution, using equal class intervals of size 10 starting with 100. 4) Compute the less-than cumulative frequencies and percents. 5) Compute the more-than cumulative frequencies and percents. 6) For the Less-than table use the Class Upper Limit and the Cumulative % column to create a Line graph 7) For the More-than table use the Class Upper Limit and the Cumulative % column to create a Line graph

Step by Step Solution

There are 3 Steps involved in it

1 Expert Approved Answer
Step: 1 Unlock blur-text-image
Question Has Been Solved by an Expert!

Get step-by-step solutions from verified subject matter experts

Step: 2 Unlock
Step: 3 Unlock

Students Have Also Explored These Related Accounting Questions!