

Question: Based on your NPV Scenario / Risk Analysis Grids, is NPV more sensitive to changing cost of capital or changing salvage values? How do you
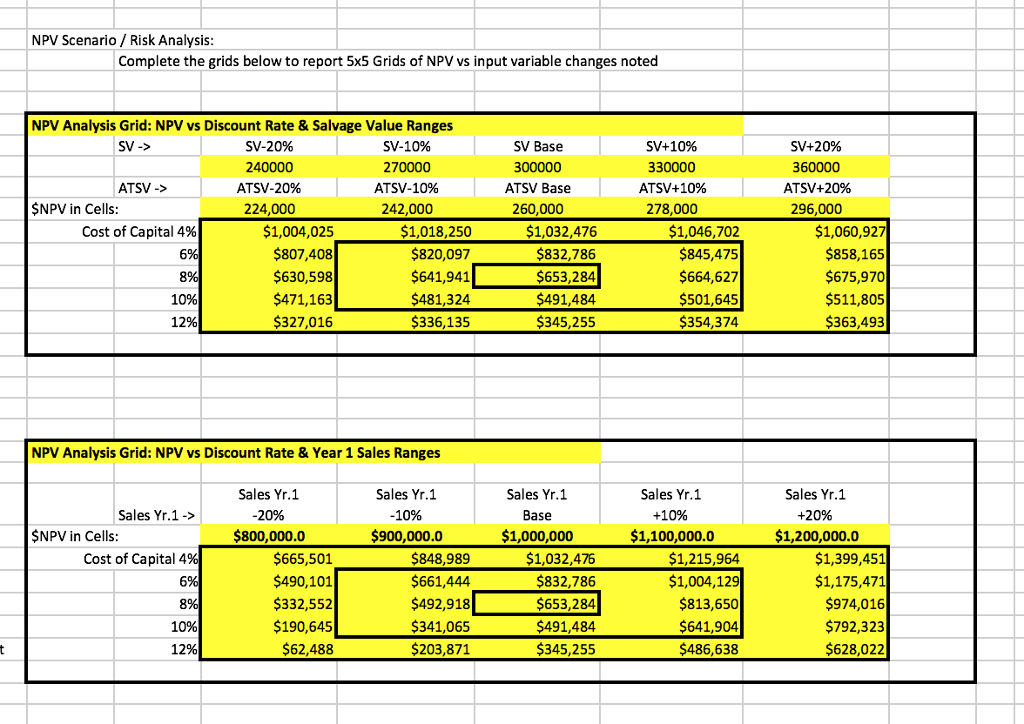
Based on your NPV Scenario / Risk Analysis Grids, is NPV more sensitive to changing cost of capital or changing salvage values? How do you determine this?
Based on your NPV Scenario / Risk Analysis Grids, is NPV more sensitive to changing cost of capital or changing year one sales level assumptions? How do you determine this?
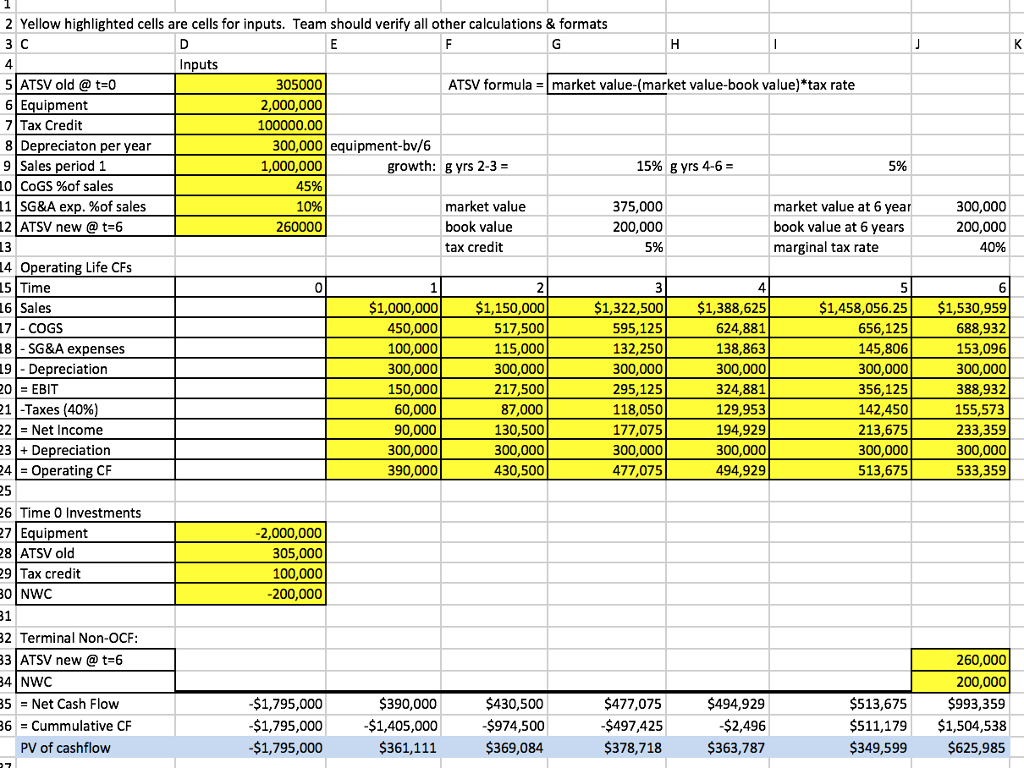
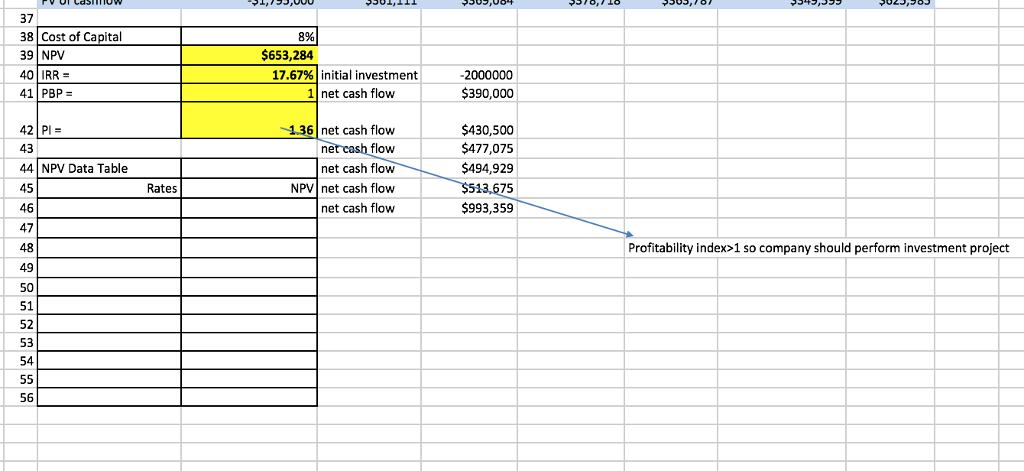
2 Yellow highlighted cells are cells for inputs. Team should verify all other calculations & formats 4 305000 2,000,000 100000.00 5 ATSV old @ t-0 ATSV formula market value-(market value-book value) tax rate quipment 300,000 equipment-bv/6 1,000,000 8 Depreciaton per year rs 10 | COGS %of sales 11 | SG&A exp. %of sales 12 ATSV new @t-6 market value 375,000 200,000 market value at 6 year book value at 6 years marginal tax rate 300,000 200,000 260000 tax credit erating Lif 1,000,000$1,150,000 517,500 115,000 300,000 217,500 87,000 130,500 300,000 430,500 1,322,500 $1,388,625 624,881 138,863 300,000 324,881 129,953 194,929 300,000 494,929 $1,458,056.25$1,530,959 688,932 153,096 300,000 388,932 155,573 233,359 300,000 533,359 17-COGS 18-SG&A expenses 19 - Depreciation 450,000 100,000 300,000 150,000 60,000 90,000 300,000 390,000 595,125 132,250 300,000 295,125 118,050 177,075 300,000 656,125 145,806 300,000 356,125 142,450 213,675 300,000 513,675 21 I-Taxes (40% 2Net Income 3Depreciation erating ClF 6 Time 0 Investments quipment 8 ATSV old 2,000,000 305,000 100,000 -200,000 2 Terminal Non-OCF: 3 ATSV new @t 6 4 NWC 5Net Cash Flow 6 Cummulative CF 260,000 200,000 $513,675 S993,359 $511,179 $1,504,538 $349,599 $625,985 $1,795,000 $1,795,000 $1,795,000 $390,000 $1,405,000 $361,111 $974,500 $369,084 $477,075 $497,425 $378,718 S494,929 $2,496 363,787 PV of cashflow 37 38 Cost of Capital 39 NPV 40 IRR- 41 PBP 8% $653,284 17.67% initial investment 2000000 $390,000 1 net cash flow $430,500 $477,075 $494,929 75 $993,359 42 PI- 43 44 NPV Data Table 45 46 47 48 49 50 51 52 53 54 1.36 net cash flow flow net cash flow NPV net cash flow net cash flow ne Rates Profitability index>1 so company should perform investment project 56 NPV Scenario/ Risk Analysis Complete the grids below to report 5x5 Grids of NPV vs input variable changes noted NPV Analysis Grid: NPV vs Discount Rate& Salvage Value Ranges SV-20% 240000 ATSV-20% 224,000 SV Base 300000 ATSV Base 260,000 SV -> SV-1096 270000 ATSV-1096 242,000 SV+10% 330000 ATSV+ 10% 278,000 SV+20% 360000 ATSV+20% 296,000 ATSV -> SNPV in Cells: $1,004,025 $807,408 $630,598 $471,163 327,016 $1,018,250 $820,097 $641,941 $481,324 336,135 $1,032,476 $832,786 $653,284 $491,484 345,255 $1,046.702 $845,475 $664,627 $501,645 354,374 $1,060,927 $858,165 $675,970 $511,805 363,493 Cost of Capital 4% 10% 12% NPV Analysis Grid: NPV vs Discount Rate & Year 1 Sales Ranges Sales Yr.1 Sales Yr.1 -10% $900,000.0 Sales Yr.1 Base 1,000,000 Sales Yr.1 +10% $1,100,000.0 Sales Yr.1 +20% $1,200,000.0 Sales Yr.1-> SNPV in Cells: $800,000.0 $665,501 $490,101 $332,552 $190,645 $62,488 848.989 $661,444 $492,918 $341,065 $203,871 $1,032,476 $832786 $653,284 $491,484 $345.255 $1,215,964 1,004,129 $813,650 $641,904 $486,638 $1,399,451 $1,175,471 $974,016 $792,323 $628,022 Cost of Capital 4 10% 12% 2 Yellow highlighted cells are cells for inputs. Team should verify all other calculations & formats 4 305000 2,000,000 100000.00 5 ATSV old @ t-0 ATSV formula market value-(market value-book value) tax rate quipment 300,000 equipment-bv/6 1,000,000 8 Depreciaton per year rs 10 | COGS %of sales 11 | SG&A exp. %of sales 12 ATSV new @t-6 market value 375,000 200,000 market value at 6 year book value at 6 years marginal tax rate 300,000 200,000 260000 tax credit erating Lif 1,000,000$1,150,000 517,500 115,000 300,000 217,500 87,000 130,500 300,000 430,500 1,322,500 $1,388,625 624,881 138,863 300,000 324,881 129,953 194,929 300,000 494,929 $1,458,056.25$1,530,959 688,932 153,096 300,000 388,932 155,573 233,359 300,000 533,359 17-COGS 18-SG&A expenses 19 - Depreciation 450,000 100,000 300,000 150,000 60,000 90,000 300,000 390,000 595,125 132,250 300,000 295,125 118,050 177,075 300,000 656,125 145,806 300,000 356,125 142,450 213,675 300,000 513,675 21 I-Taxes (40% 2Net Income 3Depreciation erating ClF 6 Time 0 Investments quipment 8 ATSV old 2,000,000 305,000 100,000 -200,000 2 Terminal Non-OCF: 3 ATSV new @t 6 4 NWC 5Net Cash Flow 6 Cummulative CF 260,000 200,000 $513,675 S993,359 $511,179 $1,504,538 $349,599 $625,985 $1,795,000 $1,795,000 $1,795,000 $390,000 $1,405,000 $361,111 $974,500 $369,084 $477,075 $497,425 $378,718 S494,929 $2,496 363,787 PV of cashflow 37 38 Cost of Capital 39 NPV 40 IRR- 41 PBP 8% $653,284 17.67% initial investment 2000000 $390,000 1 net cash flow $430,500 $477,075 $494,929 75 $993,359 42 PI- 43 44 NPV Data Table 45 46 47 48 49 50 51 52 53 54 1.36 net cash flow flow net cash flow NPV net cash flow net cash flow ne Rates Profitability index>1 so company should perform investment project 56 NPV Scenario/ Risk Analysis Complete the grids below to report 5x5 Grids of NPV vs input variable changes noted NPV Analysis Grid: NPV vs Discount Rate& Salvage Value Ranges SV-20% 240000 ATSV-20% 224,000 SV Base 300000 ATSV Base 260,000 SV -> SV-1096 270000 ATSV-1096 242,000 SV+10% 330000 ATSV+ 10% 278,000 SV+20% 360000 ATSV+20% 296,000 ATSV -> SNPV in Cells: $1,004,025 $807,408 $630,598 $471,163 327,016 $1,018,250 $820,097 $641,941 $481,324 336,135 $1,032,476 $832,786 $653,284 $491,484 345,255 $1,046.702 $845,475 $664,627 $501,645 354,374 $1,060,927 $858,165 $675,970 $511,805 363,493 Cost of Capital 4% 10% 12% NPV Analysis Grid: NPV vs Discount Rate & Year 1 Sales Ranges Sales Yr.1 Sales Yr.1 -10% $900,000.0 Sales Yr.1 Base 1,000,000 Sales Yr.1 +10% $1,100,000.0 Sales Yr.1 +20% $1,200,000.0 Sales Yr.1-> SNPV in Cells: $800,000.0 $665,501 $490,101 $332,552 $190,645 $62,488 848.989 $661,444 $492,918 $341,065 $203,871 $1,032,476 $832786 $653,284 $491,484 $345.255 $1,215,964 1,004,129 $813,650 $641,904 $486,638 $1,399,451 $1,175,471 $974,016 $792,323 $628,022 Cost of Capital 4 10% 12%
Step by Step Solution
There are 3 Steps involved in it

Get step-by-step solutions from verified subject matter experts