

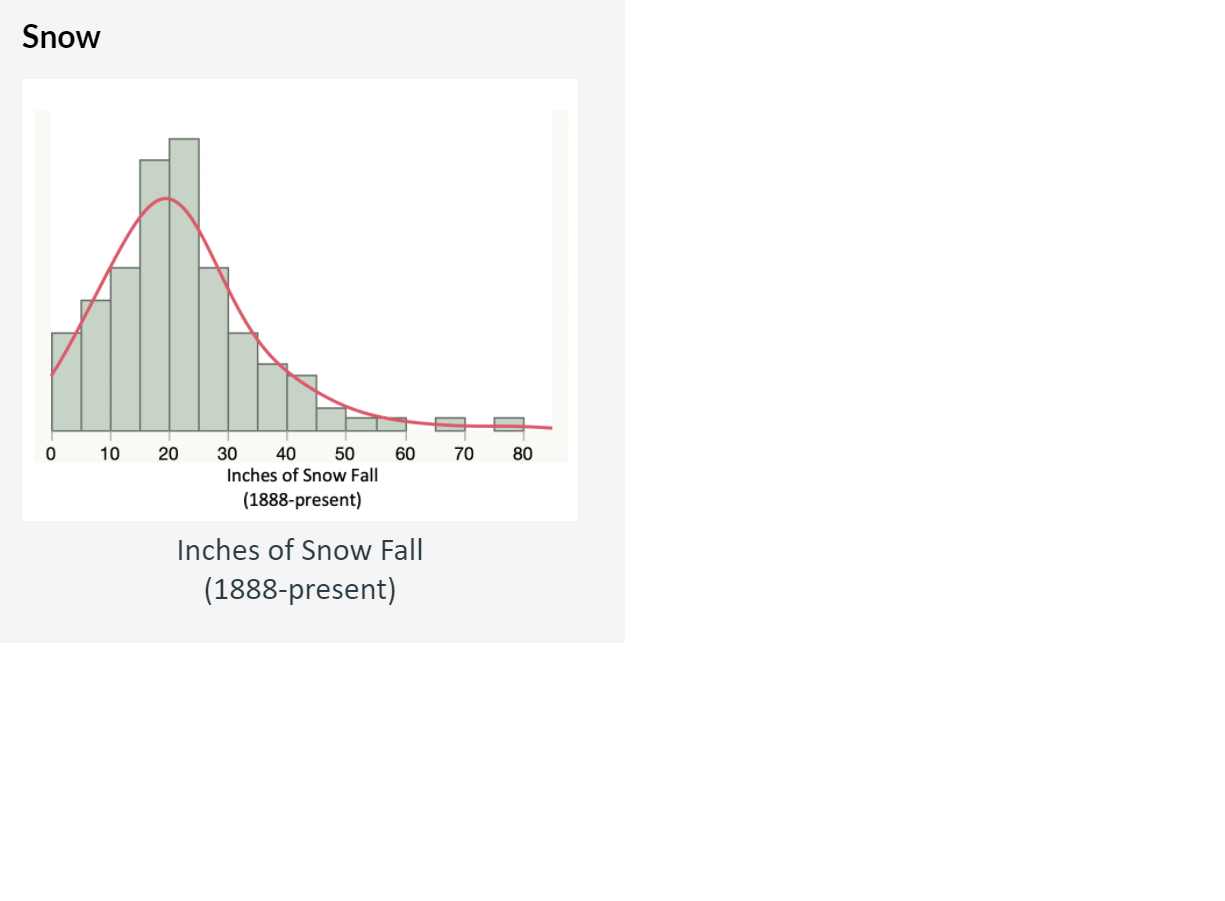
Question: Basically I don't understand histograms.... How can I infer how frequently there were less than 5 inches of snow without knowing the Y axis values?
Basically I don't understand histograms.... How can I infer how frequently there were less than 5 inches of snow without knowing the Y axis values?
Do I have to assume that 50% of the distribution is to the left of the median and then eyeball how big the bar 0-5 is compared to the other ones?
a) How frequently did Philadelphia get less than 5 inches of snow?
B) If you wanted to show that years with small amounts of snow are more frequent in the last 50 years than they were a 100 years ago, you should
-Compare the median snowfall in the last 50 years to the median snowfall from 1888-1938.?
-Compare the mean snowfall in the last 50 years to the mean snowfall from 1888-1938.
-Compare the max snowfall in the last 50 years to the max snowfall from 1888-1938.
\f
Step by Step Solution
There are 3 Steps involved in it

Get step-by-step solutions from verified subject matter experts