

Question: b-create a histogram below C-Does the data approximate a normal distribution? explain D- Determine the mean of the data E- determine the range and standard
b-create a histogram below C-Does the data approximate a normal distribution? explain D- Determine the mean of the data E- determine the range and standard deviation of the data. describe what these measures tell you about the data
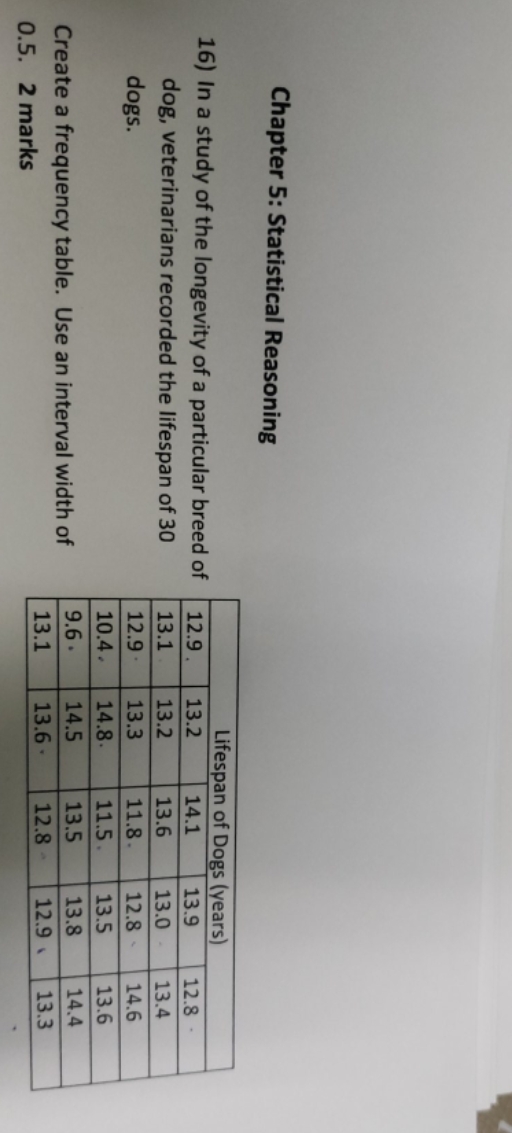
Chapter 5: Statistical Reasoning Lifespan of Dogs (years) 16) In a study of the longevity of a particular breed of 12.9. 13.2 14.1 13.9 12.8 dog, veterinarians recorded the lifespan of 30 13.1 13.2 13.6 13.0 13.4 dogs. 12.9 . 13.3 11.8. 12.8 14.6 10.4. 14.8. 11.5 13.5 13.6 Create a frequency table. Use an interval width of 9.6 . 14.5 13.5 13.8 14.4 13.6 . 12.9 . 13.3 0.5. 2 marks 13.1 12.8
Step by Step Solution
There are 3 Steps involved in it
1 Expert Approved Answer
Step: 1 Unlock

Question Has Been Solved by an Expert!
Get step-by-step solutions from verified subject matter experts
Step: 2 Unlock
Step: 3 Unlock