

Question: Before we proceed, let's review how correct ticket sale values are calculated for Zone 1. Projections for the Three-Price Model PROJECTED TICKET SALES Seat
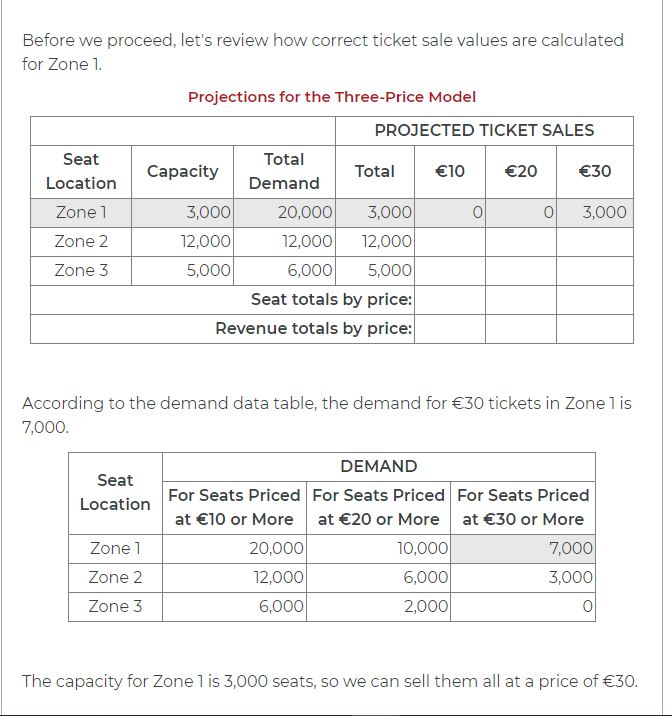
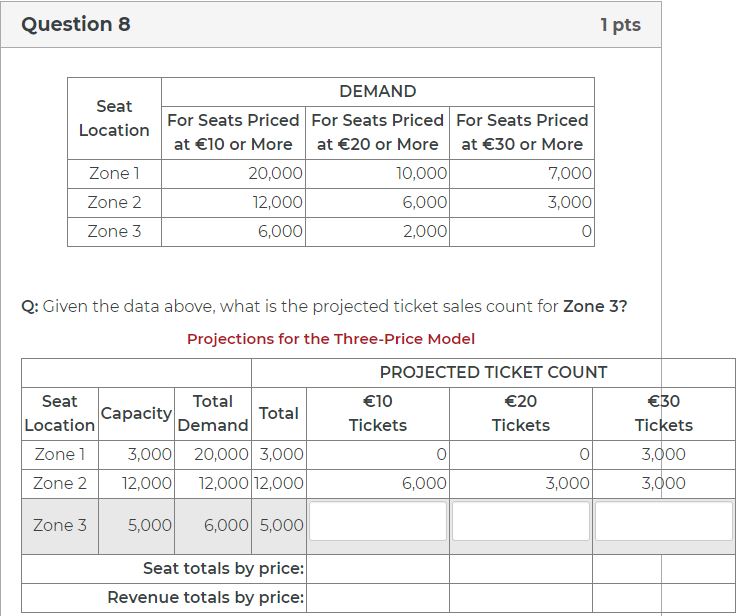
Before we proceed, let's review how correct ticket sale values are calculated for Zone 1. Projections for the Three-Price Model PROJECTED TICKET SALES Seat Total Capacity Total 10 20 30 Location Demand Zone 1 3,000 20,000 3,000 0 0 3,000 Zone 2 12,000 12,000 12,000 Zone 3 5,000 6,000 5,000 Seat totals by price: Revenue totals by price: According to the demand data table, the demand for 30 tickets in Zone 1 is 7,000. DEMAND Seat Location For Seats Priced For Seats Priced For Seats Priced at 10 or More at 20 or More at 30 or More Zone 1 20,000 10,000 7,000 Zone 2 12,000 6,000 3,000 Zone 3 6,000 2,000 The capacity for Zone 1 is 3,000 seats, so we can sell them all at a price of 30. Question 8 DEMAND Seat Location Zone 1 For Seats Priced For Seats Priced For Seats Priced at 10 or More at 20 or More at 30 or More 20,000 10,000 7,000 Zone 2 12,000 6,000 3,000 Zone 3 6,000 2,000 1 pts Q: Given the data above, what is the projected ticket sales count for Zone 3? Projections for the Three-Price Model PROJECTED TICKET COUNT Capacity Seat Location Zone 1 3,000 20,000 3,000 Zone 2 12,000 Total Demand 10 20 30 Total Tickets Tickets Tickets 0 3,000 12,000 12,000 6,000 3,000 3,000 Zone 3 5,000 6,000 5,000 Seat totals by price: Revenue totals by price:
Step by Step Solution
There are 3 Steps involved in it

Get step-by-step solutions from verified subject matter experts