

Question: begin{tabular}{cccc} hline SampleSize,n & MeanFactor,A2 & UpperRange,D4 & LowerRange,D3 hline 2 & 1.880 & 3.268 & 0 3 & 1.023 & 2.574 &
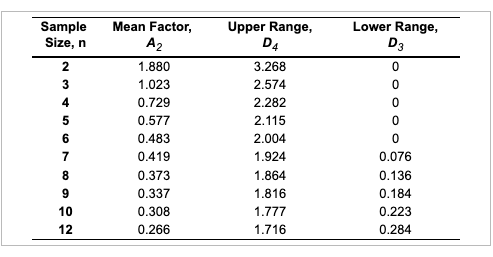
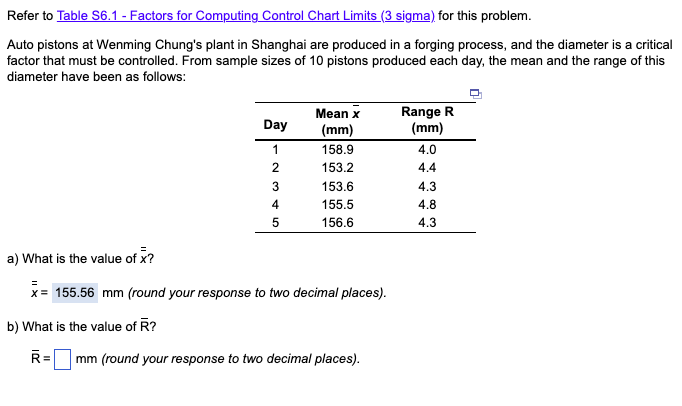
\begin{tabular}{cccc} \hline SampleSize,n & MeanFactor,A2 & UpperRange,D4 & LowerRange,D3 \\ \hline 2 & 1.880 & 3.268 & 0 \\ 3 & 1.023 & 2.574 & 0 \\ 4 & 0.729 & 2.282 & 0 \\ 5 & 0.577 & 2.115 & 0 \\ 6 & 0.483 & 2.004 & 0 \\ 7 & 0.419 & 1.924 & 0.076 \\ 8 & 0.373 & 1.864 & 0.136 \\ 9 & 0.337 & 1.816 & 0.184 \\ 10 & 0.308 & 1.777 & 0.223 \\ 12 & 0.266 & 1.716 & 0.284 \\ \hline \end{tabular} Refer to Table S6.1 - Factors for Computing Control Chart Limits (3 sigma) for this problem. Auto pistons at Wenming Chung's plant in Shanghai are produced in a forging process, and the diameter is a critical factor that must be controlled. From sample sizes of 10 pistons produced each day, the mean and the range of this diameter have been as follows: a) What is the value of x ? x=mm(roundyourresponsetotwodecimalplaces). b) What is the value of R ? R=mm(roundyourresponsetotwodecimalplaces).
Step by Step Solution
There are 3 Steps involved in it

Get step-by-step solutions from verified subject matter experts