

Question: problem 3 Processing new accounts at a bank is intended to average 10 minutes each. Five samples of seven observations (n) each have been taken.
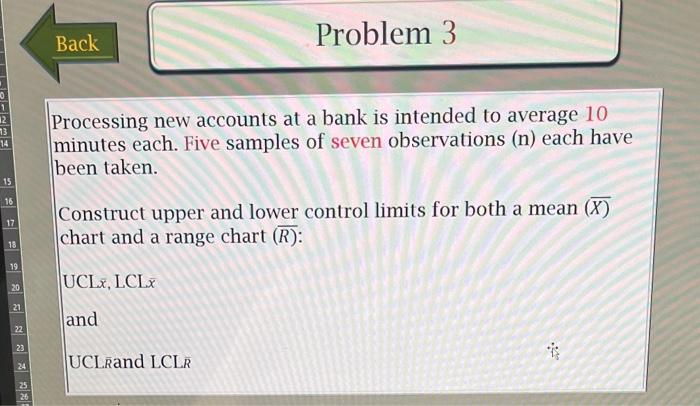
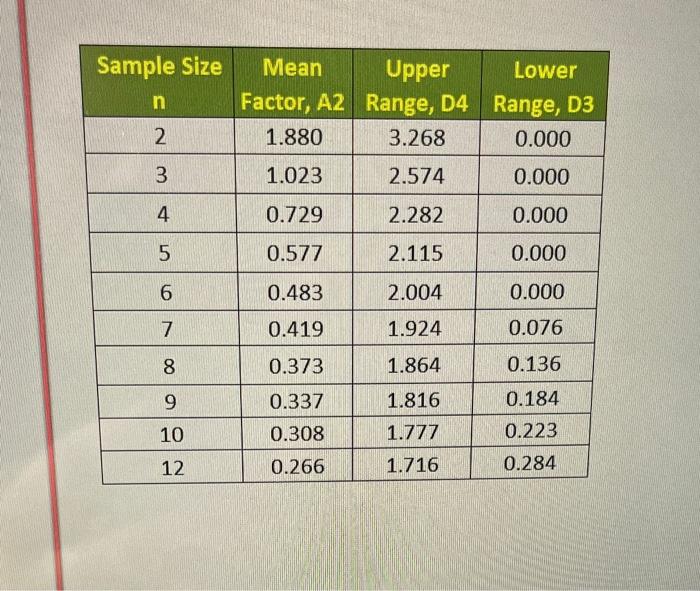
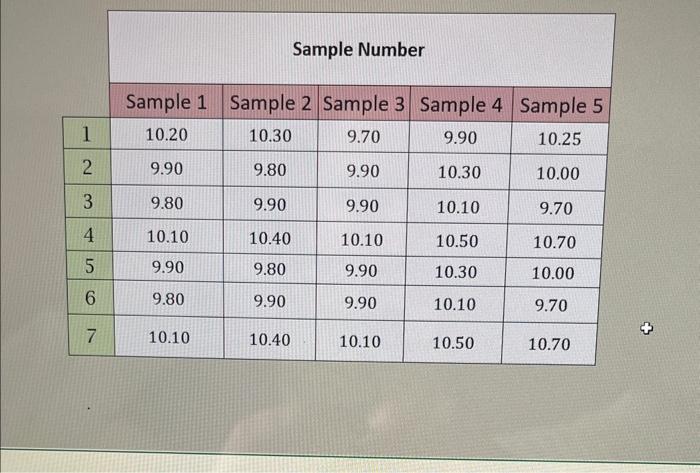
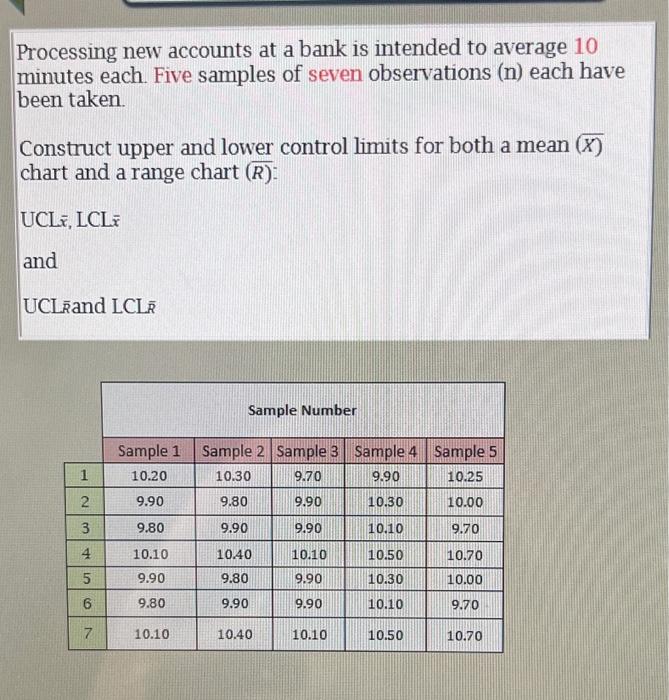
Processing new accounts at a bank is intended to average 10 minutes each. Five samples of seven observations (n) each have been taken. Construct upper and lower control limits for both a mean (X) chart and a range chart (R) : UCL x, LCL x and UCL k and LCL k \begin{tabular}{|c|c|c|c|} \hline Sample Size & Meann & UpperFactor,A2 & Range,D4Range,D3 \\ \hline 2 & 1.880 & 3.268 & 0.000 \\ \hline 3 & 1.023 & 2.574 & 0.000 \\ \hline 4 & 0.729 & 2.282 & 0.000 \\ \hline 5 & 0.577 & 2.115 & 0.000 \\ \hline 6 & 0.483 & 2.004 & 0.000 \\ \hline 7 & 0.419 & 1.924 & 0.076 \\ \hline 8 & 0.373 & 1.864 & 0.136 \\ \hline 9 & 0.337 & 1.816 & 0.184 \\ \hline 10 & 0.308 & 1.777 & 0.223 \\ \hline 12 & 0.266 & 1.716 & 0.284 \\ \hline \end{tabular} Sample Number \begin{tabular}{|c|c|c|c|c|c|} \cline { 2 - 6 } \multicolumn{1}{c|}{} & Sample 1 & Sample 2 & Sample 3 & Sample 4 & Sample 5 \\ \hline 1 & 10.20 & 10.30 & 9.70 & 9.90 & 10.25 \\ \hline 2 & 9.90 & 9.80 & 9.90 & 10.30 & 10.00 \\ \hline 3 & 9.80 & 9.90 & 9.90 & 10.10 & 9.70 \\ \hline 4 & 10.10 & 10.40 & 10.10 & 10.50 & 10.70 \\ \hline 5 & 9.90 & 9.80 & 9.90 & 10.30 & 10.00 \\ \hline 6 & 9.80 & 9.90 & 9.90 & 10.10 & 9.70 \\ \hline 7 & 10.10 & 10.40 & 10.10 & 10.50 & 10.70 \\ \hline \end{tabular} Processing new accounts at a bank is intended to average 10 minutes each. Five samples of seven observations (n) each have been taken. Construct upper and lower control limits for both a mean (X) chart and a range chart (R) : UCLx,LCLx and UCL k and LCL k
Step by Step Solution
There are 3 Steps involved in it

Get step-by-step solutions from verified subject matter experts