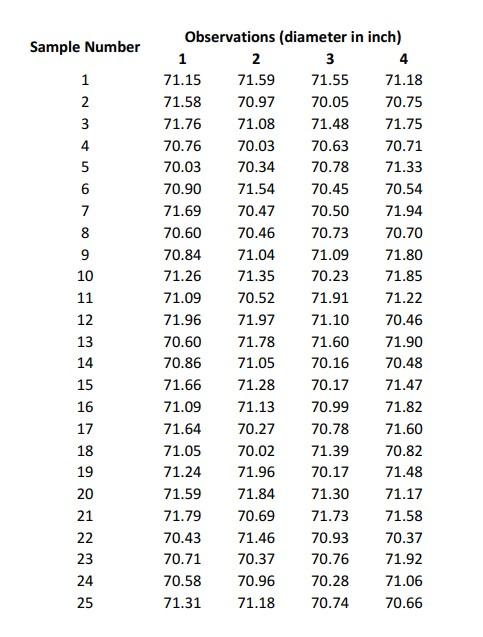
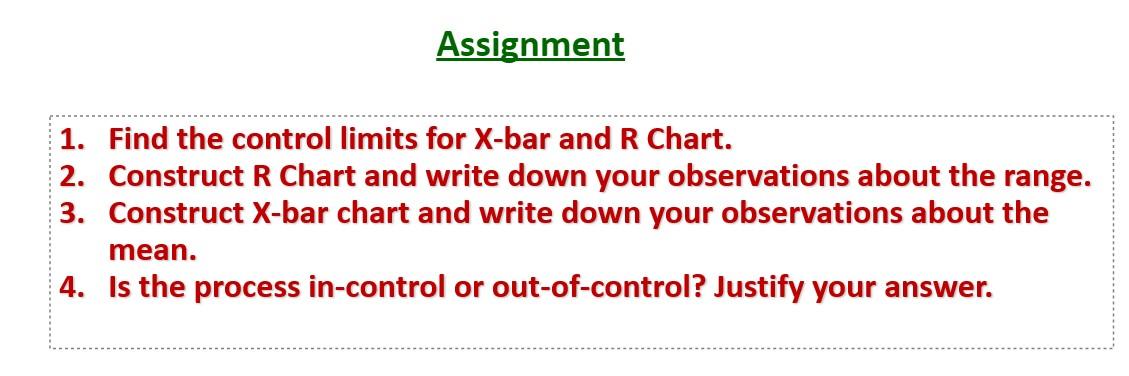
Question: begin{tabular}{ccccc} Sample Number & multicolumn{4}{c}{ Observations (diameter in inch) } 1 & 1 & 2 & 3 & 4 2 & 71.15 &

\begin{tabular}{ccccc} Sample Number &\begin{tabular}{ccccc} Sample Number &

\begin{tabular}{ccccc} Sample Number & \multicolumn{4}{c}{ Observations (diameter in inch) } \\ 1 & 1 & 2 & 3 & 4 \\ 2 & 71.15 & 71.59 & 71.55 & 71.18 \\ 3 & 71.58 & 70.97 & 70.05 & 70.75 \\ 4 & 71.76 & 71.08 & 71.48 & 71.75 \\ 5 & 70.76 & 70.03 & 70.63 & 70.71 \\ 6 & 70.03 & 70.34 & 70.78 & 71.33 \\ 7 & 70.90 & 71.54 & 70.45 & 70.54 \\ 8 & 71.69 & 70.47 & 70.50 & 71.94 \\ 9 & 70.84 & 70.46 & 70.73 & 70.70 \\ 10 & 71.26 & 71.35 & 71.09 & 71.80 \\ 11 & 71.09 & 70.52 & 71.91 & 71.85 \\ 12 & 71.96 & 71.97 & 71.10 & 70.46 \\ 13 & 70.60 & 71.78 & 71.60 & 71.90 \\ 14 & 70.86 & 71.05 & 70.16 & 70.48 \\ 15 & 71.66 & 71.28 & 70.17 & 71.47 \\ 16 & 71.09 & 71.13 & 70.99 & 71.82 \\ 17 & 71.64 & 70.27 & 70.78 & 71.60 \\ 18 & 71.05 & 70.02 & 71.39 & 70.82 \\ 19 & 71.24 & 71.96 & 70.17 & 71.48 \\ 20 & 71.59 & 71.84 & 71.30 & 71.17 \\ 21 & 71.79 & 70.69 & 71.73 & 71.58 \\ 22 & 70.43 & 71.46 & 70.93 & 70.37 \\ 23 & 70.71 & 70.37 & 70.76 & 71.92 \\ 24 & 70.58 & 70.96 & 70.28 & 71.06 \\ 25 & 71.31 & 71.18 & 70.74 & 70.66 \end{tabular} 1. Find the control limits for X-bar and R Chart. 2. Construct R Chart and write down your observations about the range. 3. Construct X-bar chart and write down your observations about the mean. 4. Is the process in-control or out-of-control? Justify your

Step by Step Solution

There are 3 Steps involved in it

1 Expert Approved Answer
Step: 1 Unlock blur-text-image
Question Has Been Solved by an Expert!

Get step-by-step solutions from verified subject matter experts

Step: 2 Unlock
Step: 3 Unlock

Students Have Also Explored These Related General Management Questions!