

Question: begin{tabular}{|c|c|c|c|c|c|} hline 5 & multicolumn{5}{|c|}{ For this assignment you are to perform some research. Find time series data on something you want to }
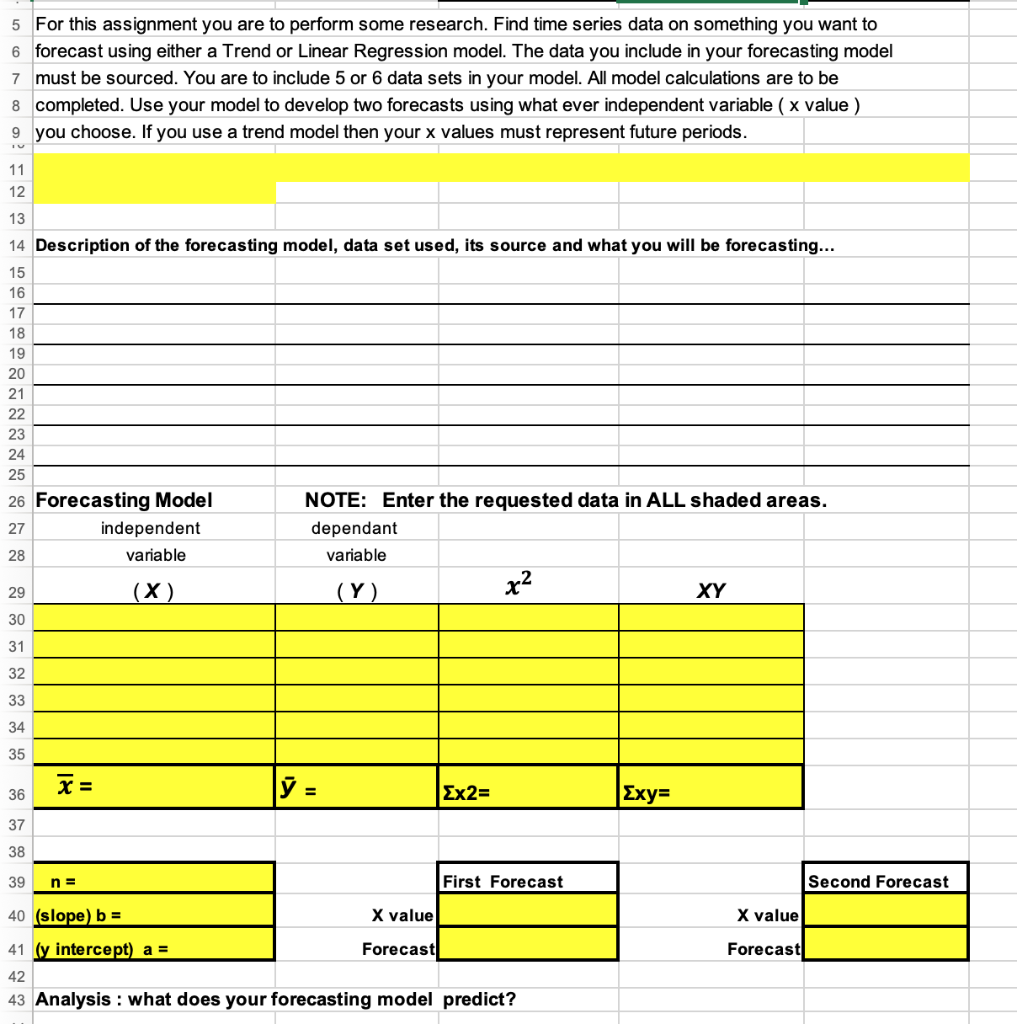
\begin{tabular}{|c|c|c|c|c|c|} \hline 5 & \multicolumn{5}{|c|}{ For this assignment you are to perform some research. Find time series data on something you want to } \\ \hline 6 & \multicolumn{5}{|c|}{ forecast using either a Trend or Linear Regression model. The data you include in your forecasting model } \\ \hline 7 & \multicolumn{5}{|c|}{ must be sourced. You are to include 5 or 6 data sets in your model. All model calculations are to be } \\ \hline 8 & \multicolumn{5}{|c|}{ completed. Use your model to develop two forecasts using what ever independent variable ( x value ) } \\ \hline & \multirow{2}{*}{\multicolumn{5}{|c|}{ you choose. If you use a trend model then your x values must represent future periods. }} \\ \hline \multicolumn{2}{|l|}{1112} & & & & \\ \hline \multicolumn{6}{|l|}{12} \\ \hline 13 & & & & & \\ \hline 14 & \multicolumn{5}{|c|}{ Description of the forecasting model, data set used, its source and what you will be forecasting... } \\ \hline \multicolumn{6}{|l|}{15} \\ \hline \multicolumn{6}{|l|}{16} \\ \hline \multicolumn{6}{|l|}{17} \\ \hline \multicolumn{6}{|l|}{18} \\ \hline \multirow{2}{*}{\multicolumn{6}{|c|}{1920}} \\ \hline & & & & & \\ \hline \multicolumn{6}{|l|}{21} \\ \hline \multicolumn{6}{|l|}{22} \\ \hline \multicolumn{6}{|l|}{23} \\ \hline \multicolumn{6}{|l|}{24} \\ \hline \multicolumn{6}{|c|}{25} \\ \hline \multicolumn{2}{|r|}{26 Forecasting Model } & \multicolumn{4}{|c|}{ NOTE: Enter the requested data in ALL shaded areas. } \\ \hline 27 & independent & dependant & & & \\ \hline 28 & variable & variable & & & \\ \hline 29 & (X) & (Y) & x2 & XY & \\ \hline \multicolumn{6}{|l|}{30} \\ \hline \multicolumn{6}{|l|}{31} \\ \hline \multicolumn{6}{|l|}{32} \\ \hline \multicolumn{6}{|l|}{33} \\ \hline \multicolumn{6}{|l|}{34} \\ \hline \multicolumn{6}{|l|}{35} \\ \hline 36 & x= & y= & 2= & xy= & \\ \hline 37 & & & & & \\ \hline 38 & & & & & \\ \hline 39 & n= & & First Forecast & & Second Forecast \\ \hline 40 & (slope) b= & X value & & X value & \\ \hline 41 & (y intercept) a= & Forecast & & Forecast & \\ \hline 42 & & & & & \\ \hline 43 & Analysis : what does & forecasting model & predict? & & \\ \hline \end{tabular} \begin{tabular}{|c|c|c|c|c|c|} \hline 5 & \multicolumn{5}{|c|}{ For this assignment you are to perform some research. Find time series data on something you want to } \\ \hline 6 & \multicolumn{5}{|c|}{ forecast using either a Trend or Linear Regression model. The data you include in your forecasting model } \\ \hline 7 & \multicolumn{5}{|c|}{ must be sourced. You are to include 5 or 6 data sets in your model. All model calculations are to be } \\ \hline 8 & \multicolumn{5}{|c|}{ completed. Use your model to develop two forecasts using what ever independent variable ( x value ) } \\ \hline & \multirow{2}{*}{\multicolumn{5}{|c|}{ you choose. If you use a trend model then your x values must represent future periods. }} \\ \hline \multicolumn{2}{|l|}{1112} & & & & \\ \hline \multicolumn{6}{|l|}{12} \\ \hline 13 & & & & & \\ \hline 14 & \multicolumn{5}{|c|}{ Description of the forecasting model, data set used, its source and what you will be forecasting... } \\ \hline \multicolumn{6}{|l|}{15} \\ \hline \multicolumn{6}{|l|}{16} \\ \hline \multicolumn{6}{|l|}{17} \\ \hline \multicolumn{6}{|l|}{18} \\ \hline \multirow{2}{*}{\multicolumn{6}{|c|}{1920}} \\ \hline & & & & & \\ \hline \multicolumn{6}{|l|}{21} \\ \hline \multicolumn{6}{|l|}{22} \\ \hline \multicolumn{6}{|l|}{23} \\ \hline \multicolumn{6}{|l|}{24} \\ \hline \multicolumn{6}{|c|}{25} \\ \hline \multicolumn{2}{|r|}{26 Forecasting Model } & \multicolumn{4}{|c|}{ NOTE: Enter the requested data in ALL shaded areas. } \\ \hline 27 & independent & dependant & & & \\ \hline 28 & variable & variable & & & \\ \hline 29 & (X) & (Y) & x2 & XY & \\ \hline \multicolumn{6}{|l|}{30} \\ \hline \multicolumn{6}{|l|}{31} \\ \hline \multicolumn{6}{|l|}{32} \\ \hline \multicolumn{6}{|l|}{33} \\ \hline \multicolumn{6}{|l|}{34} \\ \hline \multicolumn{6}{|l|}{35} \\ \hline 36 & x= & y= & 2= & xy= & \\ \hline 37 & & & & & \\ \hline 38 & & & & & \\ \hline 39 & n= & & First Forecast & & Second Forecast \\ \hline 40 & (slope) b= & X value & & X value & \\ \hline 41 & (y intercept) a= & Forecast & & Forecast & \\ \hline 42 & & & & & \\ \hline 43 & Analysis : what does & forecasting model & predict? & & \\ \hline \end{tabular}
Step by Step Solution
There are 3 Steps involved in it

Get step-by-step solutions from verified subject matter experts