

Question: begin{tabular}{|c|c|c|c|c|c|c|c|c|c|} hline & A & B & C & D & E & F & G & H hline 196 & 9/1/20 & 4.86%
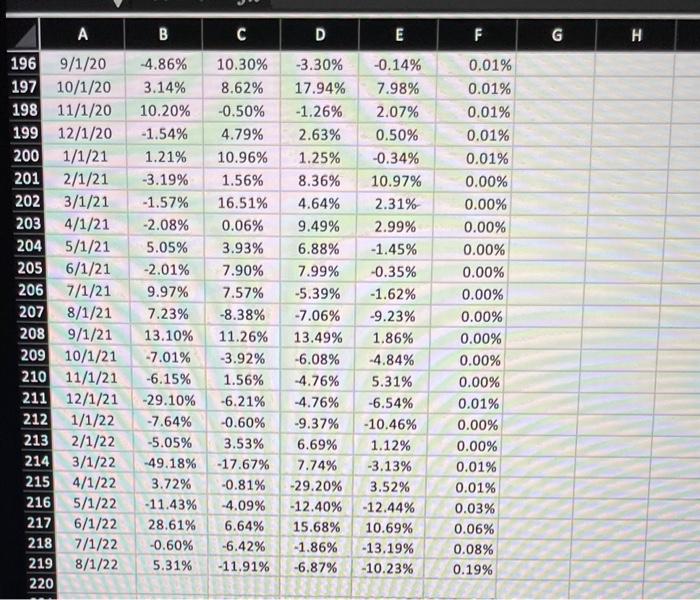
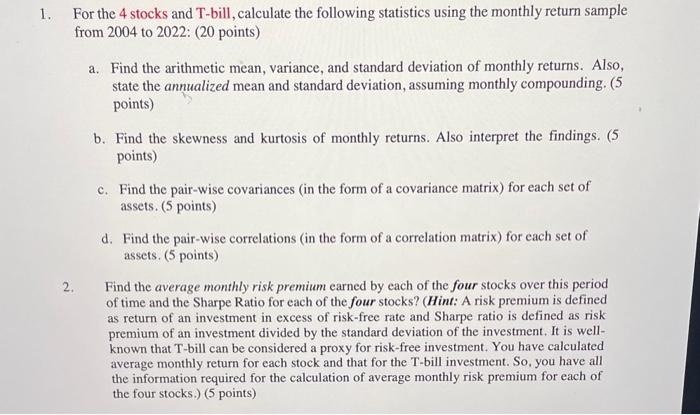
\begin{tabular}{|c|c|c|c|c|c|c|c|c|c|} \hline & A & B & C & D & E & F & G & H \\ \hline 196 & 9/1/20 & 4.86% & 10.30% & 3.30% & 0.14% & 0.01% & \\ \hline 197 & 10/1/20 & 3.14% & 8.62% & 17.94% & 7.98% & 0.01% & \\ \hline 198 & 11/1/20 & 10.20% & 0.50% & 1.26% & 2.07% & 0.01% & \\ \hline 199 & 12/1/20 & 1.54% & 4.79% & 2.63% & 0.50% & 0.01% & \\ \hline 200 & 1/1/21 & 1.21% & 10.96% & 1.25% & 0.34% & 0.01% & \\ \hline 201 & 2/1/21 & 3.19% & 1.56% & 8.36% & 10.97% & 0.00% & \\ \hline 202 & 3/1/21 & 1.57% & 16.51% & 4.64% & 2.31% & 0.00% & \\ \hline 203 & 4/1/21 & 2.08% & 0.06% & 9.49% & 2.99% & 0.00% & \\ \hline 204 & 5/1/21 & 5.05% & 3.93% & 6.88% & 1.45% & 0.00% & \\ \hline 205 & 6/1/21 & 2.01% & 7.90% & 7.99% & 0.35% & 0.00% & \\ \hline 206 & 7/1/21 & 9.97% & 7.57% & 5.39% & 1.62% & 0.00% & \\ \hline 207 & 8/1/21 & 7.23% & 8.38% & 7.06% & 9.23% & 0.00% & \\ \hline 208 & 9/1/21 & 13.10% & 11.26% & 13.49% & 1.86% & 0.00% & \\ \hline 209 & 10/1/21 & 7.01% & 3.92% & 6.08% & 4.84% & 0.00% & \\ \hline 210 & 11/1/21 & 6.15% & 1.56% & 4.76% & 5.31% & 0.00% & \\ \hline 211 & 12/1/21 & 29.10% & 6.21% & 4.76% & 6.54% & 0.01% & \\ \hline 212 & 1/1/22 & 7.64% & 0.60% & 9.37% & 10.46% & 0.00% & \\ \hline 213 & 2/1/22 & 5.05% & 3.53% & 6.69% & 1.12% & 0.00% & \\ \hline 214 & 3/1/22 & 49.18% & 17.67% & 7.74% & 3.13% & 0.01% & \\ \hline 215 & 4/1/22 & 3.72% & 0.81% & 29.20% & 3.52% & 0.01% & \\ \hline 216 & 5/1/22 & 11.43% & 4.09% & 12.40% & 12.44% & 0.03% & \\ \hline 217 & 6/1/22 & 28.61% & 6.64% & 15.68% & 10.69% & 0.06% & \\ \hline 218 & 7/1/22 & 0.60% & 6.42% & 1.86% & 13.19% & 0.08% & \\ \hline 219 & 8/1/22 & 5.31% & 11.91% & 6.87% & 10.23% & 0.19% & \\ \hline 220 & & & & & & \\ \hline \end{tabular} 1. For the 4 stocks and T-bill, calculate the following statistics using the monthly return sample from 2004 to 2022: (20 points) a. Find the arithmetic mean, variance, and standard deviation of monthly returns. Also, state the annualized mean and standard deviation, assuming monthly compounding. (5 points) b. Find the skewness and kurtosis of monthly returns. Also interpret the findings. (5 points) c. Find the pair-wise covariances (in the form of a covariance matrix) for each set of assets. (5 points) d. Find the pair-wise correlations (in the form of a correlation matrix) for each set of assets. ( 5 points) 2. Find the average monthly risk premium earned by each of the four stocks over this period of time and the Sharpe Ratio for each of the four stocks? (Hint: A risk premium is defined as return of an investment in excess of risk-free rate and Sharpe ratio is defined as risk premium of an investment divided by the standard deviation of the investment. It is wellknown that T-bill can be considered a proxy for risk-free investment. You have calculated average monthly return for each stock and that for the T-bill investment. So, you have all the information required for the calculation of average monthly risk premium for each of the four stocks.) (5 points) \begin{tabular}{|c|c|c|c|c|c|c|c|c|c|} \hline & A & B & C & D & E & F & G & H \\ \hline 196 & 9/1/20 & 4.86% & 10.30% & 3.30% & 0.14% & 0.01% & \\ \hline 197 & 10/1/20 & 3.14% & 8.62% & 17.94% & 7.98% & 0.01% & \\ \hline 198 & 11/1/20 & 10.20% & 0.50% & 1.26% & 2.07% & 0.01% & \\ \hline 199 & 12/1/20 & 1.54% & 4.79% & 2.63% & 0.50% & 0.01% & \\ \hline 200 & 1/1/21 & 1.21% & 10.96% & 1.25% & 0.34% & 0.01% & \\ \hline 201 & 2/1/21 & 3.19% & 1.56% & 8.36% & 10.97% & 0.00% & \\ \hline 202 & 3/1/21 & 1.57% & 16.51% & 4.64% & 2.31% & 0.00% & \\ \hline 203 & 4/1/21 & 2.08% & 0.06% & 9.49% & 2.99% & 0.00% & \\ \hline 204 & 5/1/21 & 5.05% & 3.93% & 6.88% & 1.45% & 0.00% & \\ \hline 205 & 6/1/21 & 2.01% & 7.90% & 7.99% & 0.35% & 0.00% & \\ \hline 206 & 7/1/21 & 9.97% & 7.57% & 5.39% & 1.62% & 0.00% & \\ \hline 207 & 8/1/21 & 7.23% & 8.38% & 7.06% & 9.23% & 0.00% & \\ \hline 208 & 9/1/21 & 13.10% & 11.26% & 13.49% & 1.86% & 0.00% & \\ \hline 209 & 10/1/21 & 7.01% & 3.92% & 6.08% & 4.84% & 0.00% & \\ \hline 210 & 11/1/21 & 6.15% & 1.56% & 4.76% & 5.31% & 0.00% & \\ \hline 211 & 12/1/21 & 29.10% & 6.21% & 4.76% & 6.54% & 0.01% & \\ \hline 212 & 1/1/22 & 7.64% & 0.60% & 9.37% & 10.46% & 0.00% & \\ \hline 213 & 2/1/22 & 5.05% & 3.53% & 6.69% & 1.12% & 0.00% & \\ \hline 214 & 3/1/22 & 49.18% & 17.67% & 7.74% & 3.13% & 0.01% & \\ \hline 215 & 4/1/22 & 3.72% & 0.81% & 29.20% & 3.52% & 0.01% & \\ \hline 216 & 5/1/22 & 11.43% & 4.09% & 12.40% & 12.44% & 0.03% & \\ \hline 217 & 6/1/22 & 28.61% & 6.64% & 15.68% & 10.69% & 0.06% & \\ \hline 218 & 7/1/22 & 0.60% & 6.42% & 1.86% & 13.19% & 0.08% & \\ \hline 219 & 8/1/22 & 5.31% & 11.91% & 6.87% & 10.23% & 0.19% & \\ \hline 220 & & & & & & \\ \hline \end{tabular} 1. For the 4 stocks and T-bill, calculate the following statistics using the monthly return sample from 2004 to 2022: (20 points) a. Find the arithmetic mean, variance, and standard deviation of monthly returns. Also, state the annualized mean and standard deviation, assuming monthly compounding. (5 points) b. Find the skewness and kurtosis of monthly returns. Also interpret the findings. (5 points) c. Find the pair-wise covariances (in the form of a covariance matrix) for each set of assets. (5 points) d. Find the pair-wise correlations (in the form of a correlation matrix) for each set of assets. ( 5 points) 2. Find the average monthly risk premium earned by each of the four stocks over this period of time and the Sharpe Ratio for each of the four stocks? (Hint: A risk premium is defined as return of an investment in excess of risk-free rate and Sharpe ratio is defined as risk premium of an investment divided by the standard deviation of the investment. It is wellknown that T-bill can be considered a proxy for risk-free investment. You have calculated average monthly return for each stock and that for the T-bill investment. So, you have all the information required for the calculation of average monthly risk premium for each of the four stocks.) (5 points)
Step by Step Solution
There are 3 Steps involved in it

Get step-by-step solutions from verified subject matter experts