

Question: begin{tabular}{|c|l} hline 4 & Import gapminder.csv. Use matplotlib to show how life expectancy varies with GDP. hline end{tabular} Code and Output begin{tabular}{|l|l|} hline 5
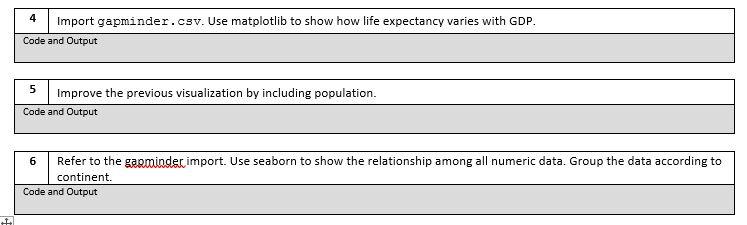
\begin{tabular}{|c|l} \hline 4 & Import gapminder.csv. Use matplotlib to show how life expectancy varies with GDP. \\ \hline \end{tabular} Code and Output \begin{tabular}{|l|l|} \hline 5 & Improve the previous visualization by including population. \\ \hline Code and Output \\ \hline \end{tabular} \begin{tabular}{|l|l|} \hline 6 & Refer to the gaominder import. Use seaborn to show the relationship among all numeric data. Group the data according to continent. \\ \hline Code and Output \\ \hline \end{tabular}
Step by Step Solution
There are 3 Steps involved in it
1 Expert Approved Answer
Step: 1 Unlock

Question Has Been Solved by an Expert!
Get step-by-step solutions from verified subject matter experts
Step: 2 Unlock
Step: 3 Unlock