

Question: begin{tabular}{c|l|c|c} hline 2 & Use the FREQUENCY function in the range H5:H9 to calculate the frequency distribution of course evaluations from the range D4:D35 based
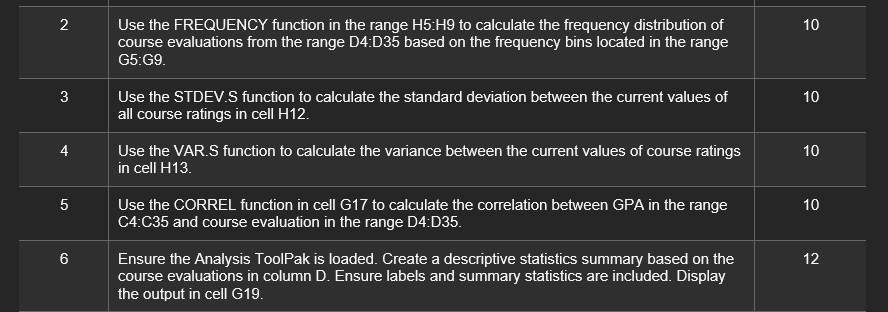
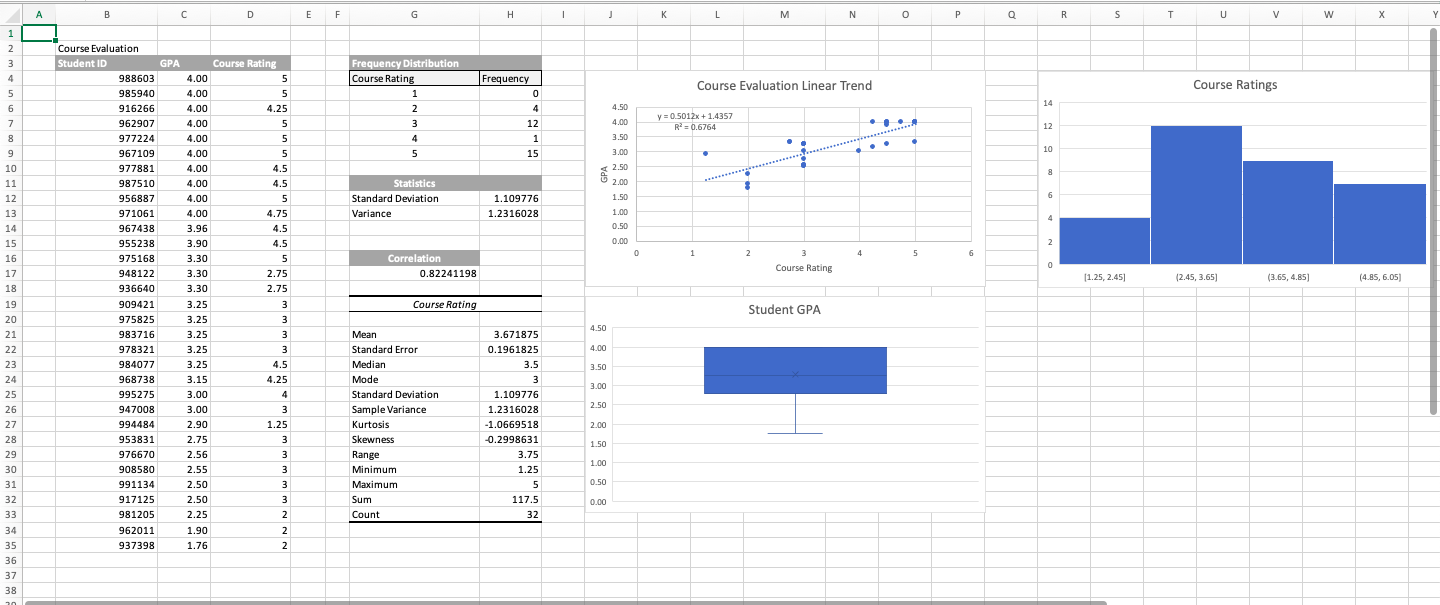
\begin{tabular}{c|l|c|c} \hline 2 & Use the FREQUENCY function in the range H5:H9 to calculate the frequency distribution of course evaluations from the range D4:D35 based on the frequency bins located in the range G5:G9. & 10 \\ \hline 3 & Use the STDEV.S function to calculate the standard deviation between the current values of all course ratings in cell H12. & 10 \\ \hline 4 & Use the VAR.S function to calculate the variance between the current values of course ratings in cell H13. & 10 \\ \hline 5 & Use the CORREL function in cell G17 to calculate the correlation between GPA in the range C4:C35 and course evaluation in the range D4:D35. & 10 \\ \hline 6 & Ensure the Analysis ToolPak is loaded. Create a descriptive statistics summary based on the course evaluations in column D. Ensure labels and summary statistics are included. Display the output in cell G19. \end{tabular} =
Step by Step Solution
There are 3 Steps involved in it

Get step-by-step solutions from verified subject matter experts