

Question: begin{tabular}{crcc} hline Activity & a & m & b hline A & 11 & 15 & 19 B & 27 & 30 &
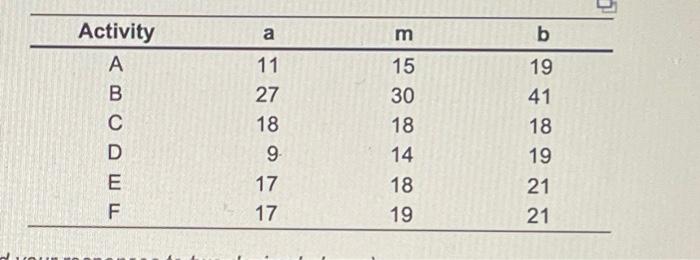
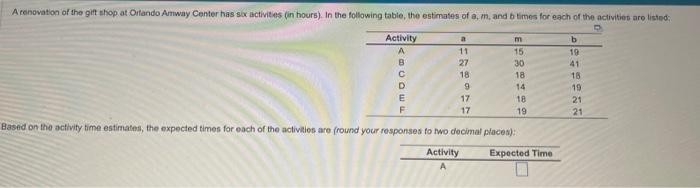
\begin{tabular}{crcc} \hline Activity & a & m & b \\ \hline A & 11 & 15 & 19 \\ B & 27 & 30 & 41 \\ C & 18 & 18 & 18 \\ D & 9 & 14 & 19 \\ E & 17 & 18 & 21 \\ F & 17 & 19 & 21 \\ \hline \end{tabular} A conovation of the git shop at Orfando Amway Center has sx activites (in hourb). In the following table, the estimates of a, m, and b times for each of the activitieb aro listed: \begin{tabular}{crrr} \hline Activity & a & m & b \\ \hline A & 11 & 15 & 19 \\ B & 27 & 30 & 41 \\ C & 18 & 18 & 18 \\ D & 9 & 14 & 19 \\ E & 17 & 18 & 21 \\ F & 17 & 19 & 21 \\ \hline \end{tabular} Based on the activity time estimates, the expected times for each of the activilies are (round your responses fo two docimal places): ActivityExpectedTime
Step by Step Solution
There are 3 Steps involved in it

Get step-by-step solutions from verified subject matter experts