

Question: begin{tabular}{l|c|c|c} & & & hline & multicolumn{1}{c|}{ Layoff } & Hiring & Inventory hline Totals & 295 & 295 & 18,000 Costs
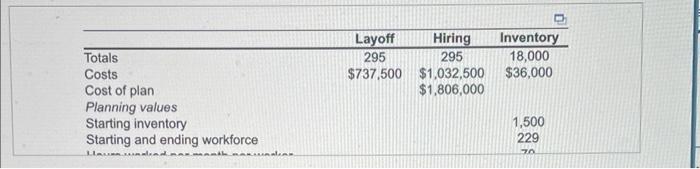
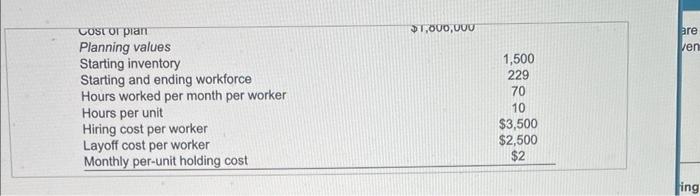
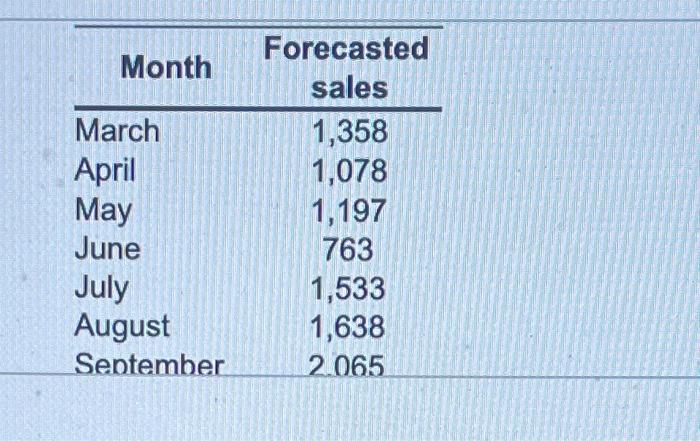
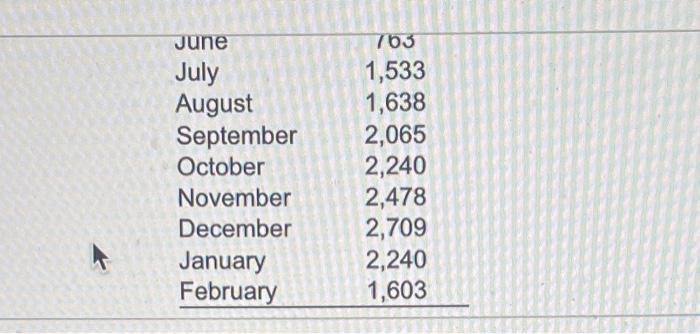
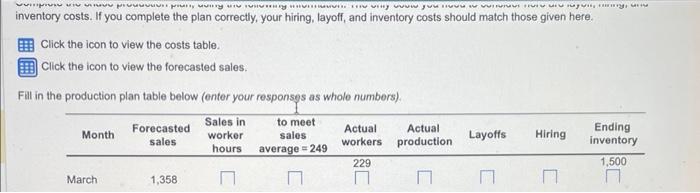
\begin{tabular}{l|c|c|c} & & & \\ \hline & \multicolumn{1}{c|}{ Layoff } & Hiring & Inventory \\ \hline Totals & 295 & 295 & 18,000 \\ Costs & $737,500 & $1,032,500 & $36,000 \\ Cost of plan & & $1,806,000 & \\ Planning values & & & \\ Starting inventory & & 1,500 \\ Starting and ending workforce & & 229 \end{tabular} costorplan $1,000,000 Planning values Starting inventory Starting and ending workforce Hours worked per month per worker Hours per unit Hiring cost per worker Layoff cost per worker Monthly per-unit holding cost \begin{tabular}{lc} \hline \multicolumn{1}{c}{ Month } & Forecastedsales \\ \hline March & 1,358 \\ April & 1,078 \\ May & 1,197 \\ June & 763 \\ July & 1,533 \\ August & 1,638 \\ Sentember & 2065 \end{tabular} \begin{tabular}{lc} June & 103 \\ July & 1,533 \\ August & 1,638 \\ September & 2,065 \\ October & 2,240 \\ November & 2,478 \\ December & 2,709 \\ January & 2,240 \\ February & 1,603 \\ \hline \end{tabular} inventory costs. If you complete the plan correctly, your hiring, layoff, and inventory costs should match those given here. Click the icon to view the costs table. Click the icon to view the forecasted sales. Fill in the production plan table below (enter your responses as whole numbers). \begin{tabular}{l|c|c|c} & & & \\ \hline & \multicolumn{1}{c|}{ Layoff } & Hiring & Inventory \\ \hline Totals & 295 & 295 & 18,000 \\ Costs & $737,500 & $1,032,500 & $36,000 \\ Cost of plan & & $1,806,000 & \\ Planning values & & & \\ Starting inventory & & 1,500 \\ Starting and ending workforce & & 229 \end{tabular} costorplan $1,000,000 Planning values Starting inventory Starting and ending workforce Hours worked per month per worker Hours per unit Hiring cost per worker Layoff cost per worker Monthly per-unit holding cost \begin{tabular}{lc} \hline \multicolumn{1}{c}{ Month } & Forecastedsales \\ \hline March & 1,358 \\ April & 1,078 \\ May & 1,197 \\ June & 763 \\ July & 1,533 \\ August & 1,638 \\ Sentember & 2065 \end{tabular} \begin{tabular}{lc} June & 103 \\ July & 1,533 \\ August & 1,638 \\ September & 2,065 \\ October & 2,240 \\ November & 2,478 \\ December & 2,709 \\ January & 2,240 \\ February & 1,603 \\ \hline \end{tabular} inventory costs. If you complete the plan correctly, your hiring, layoff, and inventory costs should match those given here. Click the icon to view the costs table. Click the icon to view the forecasted sales. Fill in the production plan table below (enter your responses as whole numbers)
Step by Step Solution
There are 3 Steps involved in it

Get step-by-step solutions from verified subject matter experts