

Question: Create a scatter plot (Chart 1) of your results from parts a) through c) with risk on the horizontal axis and expected return on the
Create a scatter plot (Chart 1) of your results from parts a) through c) with risk on the horizontal axis and expected return on the vertical axis. Plot AMZN, IBM, MSFT, the minimum risk portfolio and the 25% risk portfolio. Make sure you label each data point on the graph. If you were presenting this chart to clients, what conclusions would you draw for them? Assume that incorporating the risk-free rate is not an option. (13 points)
 e. For Chart 2, plot the minimum-variance frontier of the 3-asset portfolio and the 3 data points of the risk/return for the individual securities, assuming short sales are permitted.
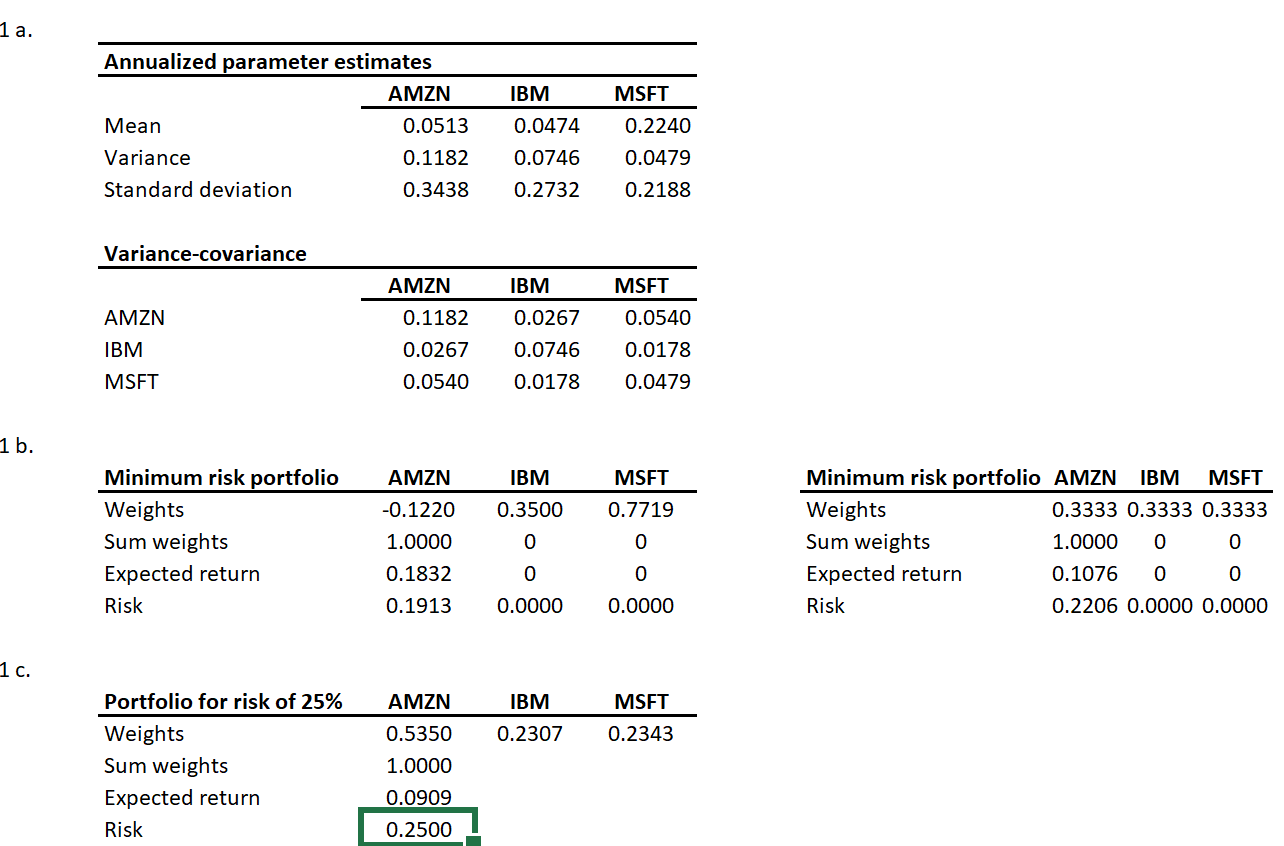
1 a. \begin{tabular}{lccc} \hline \multicolumn{4}{l}{ Annualized parameter estimates } \\ \hline & AMZN & IBM & MSFT \\ \cline { 2 - 4 } Mean & 0.0513 & 0.0474 & 0.2240 \\ Variance & 0.1182 & 0.0746 & 0.0479 \\ Standard deviation & 0.3438 & 0.2732 & 0.2188 \end{tabular} Variance-covariance \begin{tabular}{lccc} \hline & AMZN & IBM & MSFT \\ \cline { 2 - 4 } AMZN & 0.1182 & 0.0267 & 0.0540 \\ IBM & 0.0267 & 0.0746 & 0.0178 \\ MSFT & 0.0540 & 0.0178 & 0.0479 \end{tabular} 1b. \begin{tabular}{lccc} Minimum risk portfolio & AMZN & IBM & MSFT \\ \hline Weights & -0.1220 & 0.3500 & 0.7719 \\ Sum weights & 1.0000 & 0 & 0 \\ Expected return & 0.1832 & 0 & 0 \\ Risk & 0.1913 & 0.0000 & 0.0000 \end{tabular} \begin{tabular}{llcc} Minimum risk portfolio & AMZN & IBM & MSFT \\ \hline Weights & 0.3333 & 0.3333 & 0.3333 \\ Sum weights & 1.0000 & 0 & 0 \\ Expected return & 0.1076 & 0 & 0 \\ Risk & 0.2206 & 0.0000 & 0.0000 \end{tabular} 1c. \begin{tabular}{lccc} Portfolio for risk of 25\% & AMZN & IBM & MSFT \\ \hline Weights & 0.5350 & 0.2307 & 0.2343 \\ Sum weights & 1.0000 & & \\ Expected return & 0.0909 & & \\ Risk & 0.2500 & & \end{tabular} 1 a. \begin{tabular}{lccc} \hline \multicolumn{4}{l}{ Annualized parameter estimates } \\ \hline & AMZN & IBM & MSFT \\ \cline { 2 - 4 } Mean & 0.0513 & 0.0474 & 0.2240 \\ Variance & 0.1182 & 0.0746 & 0.0479 \\ Standard deviation & 0.3438 & 0.2732 & 0.2188 \end{tabular} Variance-covariance \begin{tabular}{lccc} \hline & AMZN & IBM & MSFT \\ \cline { 2 - 4 } AMZN & 0.1182 & 0.0267 & 0.0540 \\ IBM & 0.0267 & 0.0746 & 0.0178 \\ MSFT & 0.0540 & 0.0178 & 0.0479 \end{tabular} 1b. \begin{tabular}{lccc} Minimum risk portfolio & AMZN & IBM & MSFT \\ \hline Weights & -0.1220 & 0.3500 & 0.7719 \\ Sum weights & 1.0000 & 0 & 0 \\ Expected return & 0.1832 & 0 & 0 \\ Risk & 0.1913 & 0.0000 & 0.0000 \end{tabular} \begin{tabular}{llcc} Minimum risk portfolio & AMZN & IBM & MSFT \\ \hline Weights & 0.3333 & 0.3333 & 0.3333 \\ Sum weights & 1.0000 & 0 & 0 \\ Expected return & 0.1076 & 0 & 0 \\ Risk & 0.2206 & 0.0000 & 0.0000 \end{tabular} 1c. \begin{tabular}{lccc} Portfolio for risk of 25\% & AMZN & IBM & MSFT \\ \hline Weights & 0.5350 & 0.2307 & 0.2343 \\ Sum weights & 1.0000 & & \\ Expected return & 0.0909 & & \\ Risk & 0.2500 & & \end{tabular}
Step by Step Solution
There are 3 Steps involved in it

Get step-by-step solutions from verified subject matter experts