

Question: begin{tabular}{l|l} 39 & Hints for Working on this Assignment hline 40 & end{tabular} This exercises is a bit like solving a puzzle. First, you
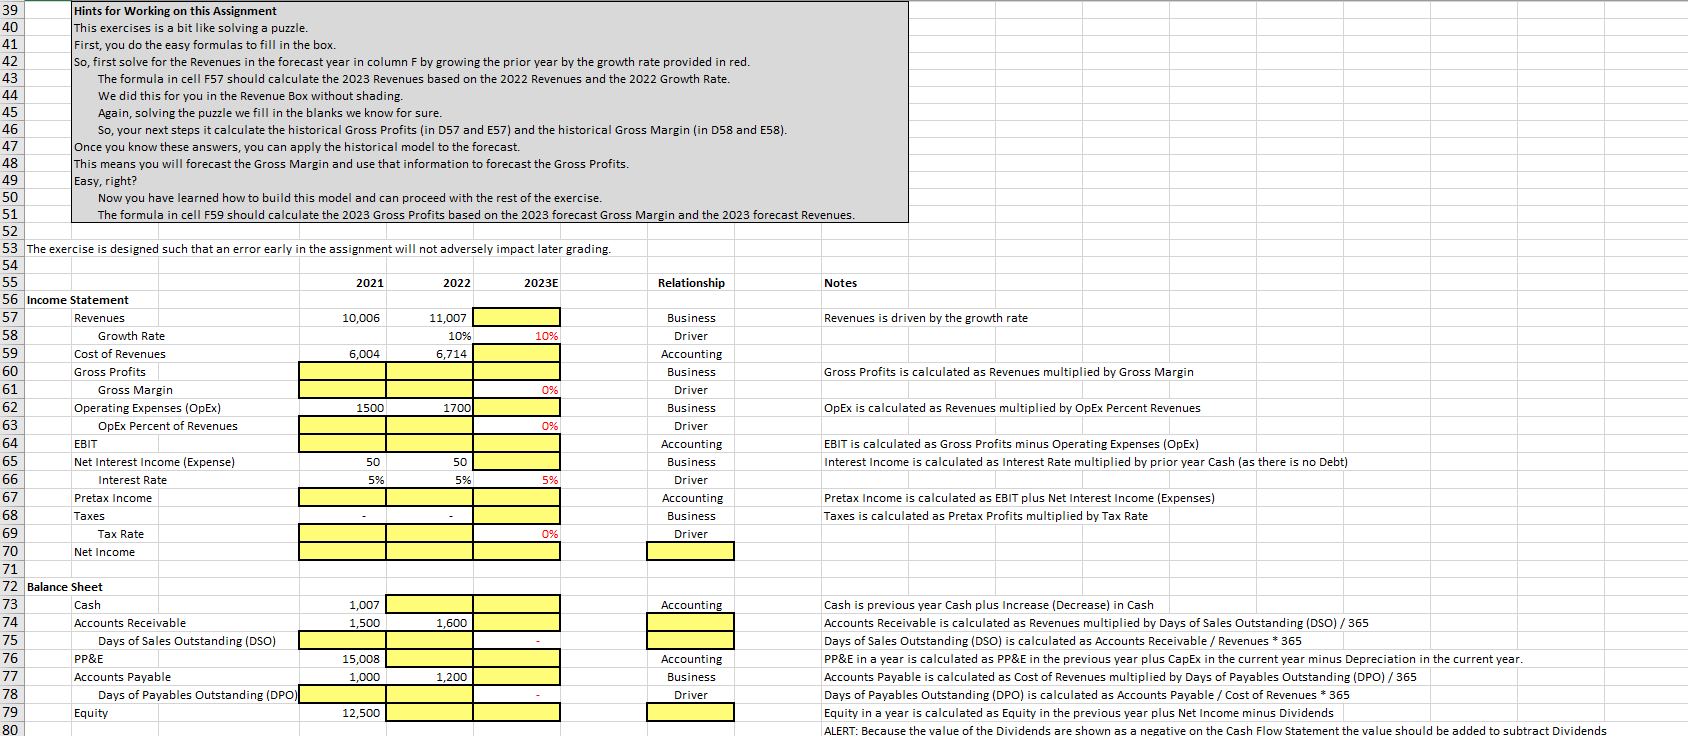
\begin{tabular}{l|l} 39 & Hints for Working on this Assignment \\ \hline 40 & \end{tabular} This exercises is a bit like solving a puzzle. First, you do the easy formulas to fill in the box. So, first solve for the Revenues in the forecast year in column F by growing the prior year by the growth rate provided in red. The formula in cell F57 should calculate the 2023 Revenues based on the 2022 Revenues and the 2022 Growth Rate. We did this for you in the Revenue Box without shading. Again, solving the puzzle we fill in the blanks we know for sure. So, your next steps it calculate the historical Gross Profits (in D57 and E57) and the historical Gross Margin (in D58 and E58). Once you know these answers, you can apply the historical model to the forecast. This means you will forecast the Gross Margin and use that information to forecast the Gross Profits. Easy, right? Now you have learned how to build this model and can proceed with the rest of the exercise. The formula in cell F59 should calculate the 2023 Gross Profits based on the 2023 forecast Gross Margin and the 2023 forecast Revenues. The exercise is designed such that an error early in the assignment will not adversely impact later grading. 54 6 In Income Statement Revenues Growth Rate \begin{tabular}{|c|c|} \hline Business & Revenues is driven by the growth rate \\ \hline Driver & \\ \hline Accouting & \end{tabular} Cost of Revenues Gross Profits Accounting Gross Profits is calculated as Revenues multiplied by Gross Margin Gross Margin Operating Expenses (OpEx) OpEx Percent of Revenues EBIT Net Interest Income (Expense) Interest Rate Taxes Tax Rate Net Income Relationship Notes Driver OpEx is calculated as Revenues multiplied by OpEx Percent Revenues \begin{tabular}{|c|l|} \hline Business & OpEx is calculated as \\ \hline Driver & EBIT is calculated as Gross Profits minus Operating Expenses (OpEx) \\ \hline Accounting & Ort \end{tabular} Business Interest Income is calculated as Interest Rate multiplied by prior year Cash (as there is no Debt) Driver Pretax Income is calculated as EBIT plus Net Interest Income (Expenses) Business Balance Sheet Cash Accounts Receivable \begin{tabular}{|l|l|l|l|} \hline Taxes is calculated as Pretax Profits multiplied by Tax Rate \\ \hline \\ \hline Cash is previous year Cash plus Increase (Decrease) in Cash \\ \hline Accounts Receivable is calculated as Revenues multiplied by Days of Sales Outstanding (DSO) / 365 \\ \hline \end{tabular} Days of Sales Outstanding (DSO) Days of Sales Outstanding (DSO) is calculated as Accounts Receivable / Revenues * 365 PP\&E PP\&E in a year is calculated as PP\&E in the previous year plus CapEx in the current year minus Depreciation in the current year. Accounts Payable Accounts Payable is calculated as Cost of Revenues multiplied by Days of Payables Outstanding (DPO) / 365 Days of Payables Outstanding (DPO) Equity Days of Payables Outstanding (DPO) is calculated as Accounts Payable / Cost of Revenues * 365 Equity in a year is calculated as Equity in the previous year plus Net Income minus Dividends \begin{tabular}{l|l} 39 & Hints for Working on this Assignment \\ \hline 40 & \end{tabular} This exercises is a bit like solving a puzzle. First, you do the easy formulas to fill in the box. So, first solve for the Revenues in the forecast year in column F by growing the prior year by the growth rate provided in red. The formula in cell F57 should calculate the 2023 Revenues based on the 2022 Revenues and the 2022 Growth Rate. We did this for you in the Revenue Box without shading. Again, solving the puzzle we fill in the blanks we know for sure. So, your next steps it calculate the historical Gross Profits (in D57 and E57) and the historical Gross Margin (in D58 and E58). Once you know these answers, you can apply the historical model to the forecast. This means you will forecast the Gross Margin and use that information to forecast the Gross Profits. Easy, right? Now you have learned how to build this model and can proceed with the rest of the exercise. The formula in cell F59 should calculate the 2023 Gross Profits based on the 2023 forecast Gross Margin and the 2023 forecast Revenues. The exercise is designed such that an error early in the assignment will not adversely impact later grading. 54 6 In Income Statement Revenues Growth Rate \begin{tabular}{|c|c|} \hline Business & Revenues is driven by the growth rate \\ \hline Driver & \\ \hline Accouting & \end{tabular} Cost of Revenues Gross Profits Accounting Gross Profits is calculated as Revenues multiplied by Gross Margin Gross Margin Operating Expenses (OpEx) OpEx Percent of Revenues EBIT Net Interest Income (Expense) Interest Rate Taxes Tax Rate Net Income Relationship Notes Driver OpEx is calculated as Revenues multiplied by OpEx Percent Revenues \begin{tabular}{|c|l|} \hline Business & OpEx is calculated as \\ \hline Driver & EBIT is calculated as Gross Profits minus Operating Expenses (OpEx) \\ \hline Accounting & Ort \end{tabular} Business Interest Income is calculated as Interest Rate multiplied by prior year Cash (as there is no Debt) Driver Pretax Income is calculated as EBIT plus Net Interest Income (Expenses) Business Balance Sheet Cash Accounts Receivable \begin{tabular}{|l|l|l|l|} \hline Taxes is calculated as Pretax Profits multiplied by Tax Rate \\ \hline \\ \hline Cash is previous year Cash plus Increase (Decrease) in Cash \\ \hline Accounts Receivable is calculated as Revenues multiplied by Days of Sales Outstanding (DSO) / 365 \\ \hline \end{tabular} Days of Sales Outstanding (DSO) Days of Sales Outstanding (DSO) is calculated as Accounts Receivable / Revenues * 365 PP\&E PP\&E in a year is calculated as PP\&E in the previous year plus CapEx in the current year minus Depreciation in the current year. Accounts Payable Accounts Payable is calculated as Cost of Revenues multiplied by Days of Payables Outstanding (DPO) / 365 Days of Payables Outstanding (DPO) Equity Days of Payables Outstanding (DPO) is calculated as Accounts Payable / Cost of Revenues * 365 Equity in a year is calculated as Equity in the previous year plus Net Income minus Dividends
Step by Step Solution
There are 3 Steps involved in it

Get step-by-step solutions from verified subject matter experts