

Question: begin{tabular}{|l|l|l|l|l|l|l|l|l|l|} hline DATE & 1mo & 3mo & 1yr & 2yr & 5yr & 7yr & 10yr & 20yr & 30yr hline 2006 &
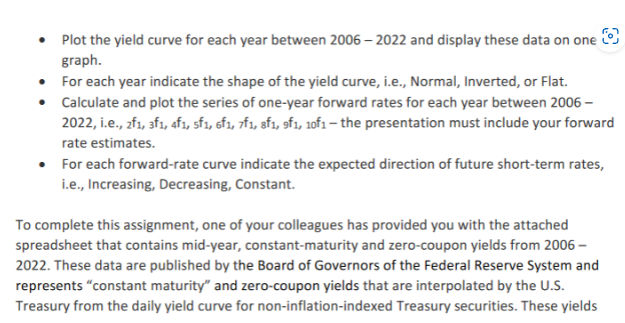
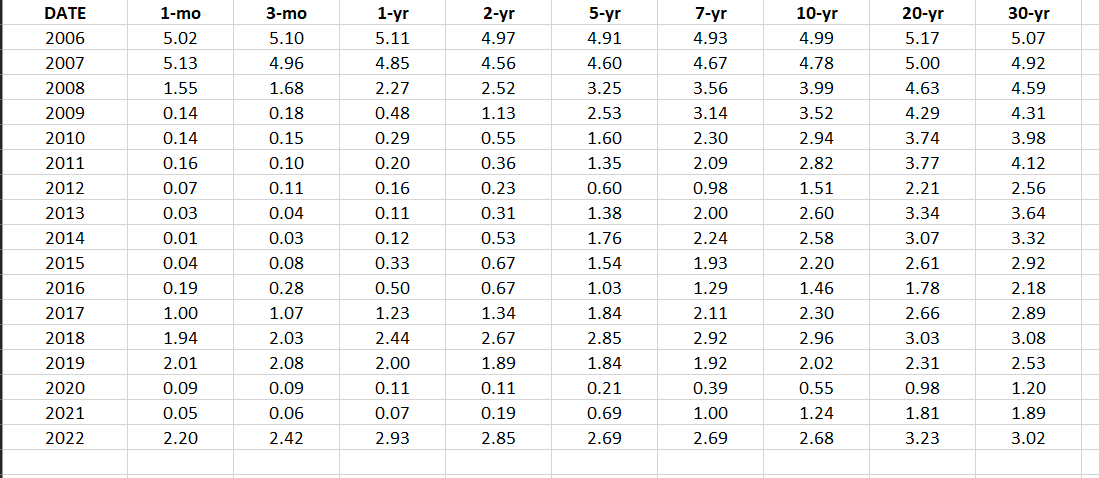
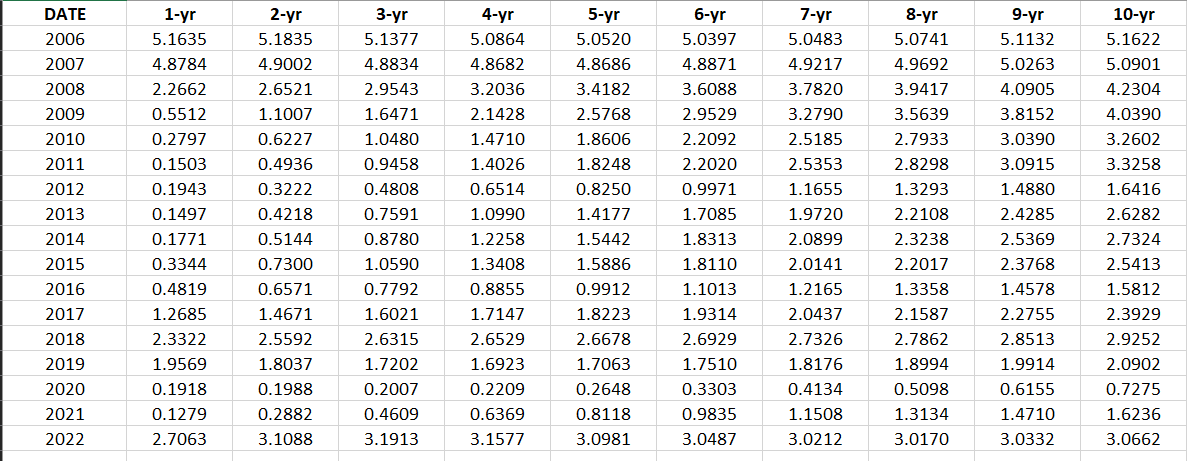
\begin{tabular}{|l|l|l|l|l|l|l|l|l|l|} \hline DATE & 1mo & 3mo & 1yr & 2yr & 5yr & 7yr & 10yr & 20yr & 30yr \\ \hline 2006 & 5.02 & 5.10 & 5.11 & 4.97 & 4.91 & 4.93 & 4.99 & 5.17 & 5.07 \\ \hline 2007 & 5.13 & 4.96 & 4.85 & 4.56 & 4.60 & 4.67 & 4.78 & 5.00 & 4.92 \\ \hline 2008 & 1.55 & 1.68 & 2.27 & 2.52 & 3.25 & 3.56 & 3.99 & 4.63 & 4.59 \\ \hline 2009 & 0.14 & 0.18 & 0.48 & 1.13 & 2.53 & 3.14 & 3.52 & 4.29 & 4.31 \\ \hline 2010 & 0.14 & 0.15 & 0.29 & 0.55 & 1.60 & 2.30 & 2.94 & 3.74 & 3.98 \\ \hline 2011 & 0.16 & 0.10 & 0.20 & 0.36 & 1.35 & 2.09 & 2.82 & 3.77 & 4.12 \\ \hline 2012 & 0.07 & 0.11 & 0.16 & 0.23 & 0.60 & 0.98 & 1.51 & 2.21 & 2.56 \\ \hline 2013 & 0.03 & 0.04 & 0.11 & 0.31 & 1.38 & 2.00 & 2.60 & 3.34 & 3.64 \\ \hline 2014 & 0.01 & 0.03 & 0.12 & 0.53 & 1.76 & 2.24 & 2.58 & 3.07 & 3.32 \\ \hline 2015 & 0.04 & 0.08 & 0.33 & 0.67 & 1.54 & 1.93 & 2.20 & 2.61 & 2.92 \\ \hline 2016 & 0.19 & 0.28 & 0.50 & 0.67 & 1.03 & 1.29 & 1.46 & 1.78 & 2.18 \\ \hline 2018 & 1.00 & 1.07 & 1.23 & 1.34 & 1.84 & 2.11 & 2.30 & 2.66 & 2.89 \\ \hline 2019 & 1.94 & 2.03 & 2.44 & 2.67 & 2.85 & 2.92 & 2.96 & 3.03 & 3.08 \\ \hline 2021 & 2.01 & 2.08 & 2.00 & 1.89 & 1.84 & 1.92 & 2.02 & 2.31 & 2.53 \\ \hline 2022 & 0.09 & 0.09 & 0.11 & 0.11 & 0.21 & 0.39 & 0.55 & 0.98 & 1.20 \\ \hline \end{tabular} - Plot the yield curve for each year between 2006-2022 and display these data on one graph. - For each year indicate the shape of the yield curve, i.e., Normal, Inverted, or Flat. - Calculate and plot the series of one-year forward rates for each year between 2006 2022 , i.e., f1,3f1,4f1,5f1,6f1,7f1,8f1,f1,10f1 the presentation must include your forward rate estimates. - For each forward-rate curve indicate the expected direction of future short-term rates, i.e., Increasing, Decreasing, Constant. To complete this assignment, one of your colleagues has provided you with the attached spreadsheet that contains mid-year, constant-maturity and zero-coupon yields from 2006 2022. These data are published by the Board of Governors of the Federal Reserve System and represents "constant maturity" and zero-coupon yields that are interpolated by the U.S. Treasury from the daily yield curve for non-inflation-indexed Treasury securities. These yields \begin{tabular}{|l|l|l|l|l|l|l|l|l|l|} \hline DATE & 1mo & 3mo & 1yr & 2yr & 5yr & 7yr & 10yr & 20yr & 30yr \\ \hline 2006 & 5.02 & 5.10 & 5.11 & 4.97 & 4.91 & 4.93 & 4.99 & 5.17 & 5.07 \\ \hline 2007 & 5.13 & 4.96 & 4.85 & 4.56 & 4.60 & 4.67 & 4.78 & 5.00 & 4.92 \\ \hline 2008 & 1.55 & 1.68 & 2.27 & 2.52 & 3.25 & 3.56 & 3.99 & 4.63 & 4.59 \\ \hline 2009 & 0.14 & 0.18 & 0.48 & 1.13 & 2.53 & 3.14 & 3.52 & 4.29 & 4.31 \\ \hline 2010 & 0.14 & 0.15 & 0.29 & 0.55 & 1.60 & 2.30 & 2.94 & 3.74 & 3.98 \\ \hline 2011 & 0.16 & 0.10 & 0.20 & 0.36 & 1.35 & 2.09 & 2.82 & 3.77 & 4.12 \\ \hline 2012 & 0.07 & 0.11 & 0.16 & 0.23 & 0.60 & 0.98 & 1.51 & 2.21 & 2.56 \\ \hline 2013 & 0.03 & 0.04 & 0.11 & 0.31 & 1.38 & 2.00 & 2.60 & 3.34 & 3.64 \\ \hline 2014 & 0.01 & 0.03 & 0.12 & 0.53 & 1.76 & 2.24 & 2.58 & 3.07 & 3.32 \\ \hline 2015 & 0.04 & 0.08 & 0.33 & 0.67 & 1.54 & 1.93 & 2.20 & 2.61 & 2.92 \\ \hline 2016 & 0.19 & 0.28 & 0.50 & 0.67 & 1.03 & 1.29 & 1.46 & 1.78 & 2.18 \\ \hline 2018 & 1.00 & 1.07 & 1.23 & 1.34 & 1.84 & 2.11 & 2.30 & 2.66 & 2.89 \\ \hline 2019 & 1.94 & 2.03 & 2.44 & 2.67 & 2.85 & 2.92 & 2.96 & 3.03 & 3.08 \\ \hline 2021 & 2.01 & 2.08 & 2.00 & 1.89 & 1.84 & 1.92 & 2.02 & 2.31 & 2.53 \\ \hline 2022 & 0.09 & 0.09 & 0.11 & 0.11 & 0.21 & 0.39 & 0.55 & 0.98 & 1.20 \\ \hline \end{tabular} - Plot the yield curve for each year between 2006-2022 and display these data on one graph. - For each year indicate the shape of the yield curve, i.e., Normal, Inverted, or Flat. - Calculate and plot the series of one-year forward rates for each year between 2006 2022 , i.e., f1,3f1,4f1,5f1,6f1,7f1,8f1,f1,10f1 the presentation must include your forward rate estimates. - For each forward-rate curve indicate the expected direction of future short-term rates, i.e., Increasing, Decreasing, Constant. To complete this assignment, one of your colleagues has provided you with the attached spreadsheet that contains mid-year, constant-maturity and zero-coupon yields from 2006 2022. These data are published by the Board of Governors of the Federal Reserve System and represents "constant maturity" and zero-coupon yields that are interpolated by the U.S. Treasury from the daily yield curve for non-inflation-indexed Treasury securities. These yields
Step by Step Solution
There are 3 Steps involved in it

Get step-by-step solutions from verified subject matter experts