

Question: begin{tabular}{|l|r|} hline Data & hline Unit sales & 20,000 units hline Selling price per unit & $60 per unit hline Variable expenses
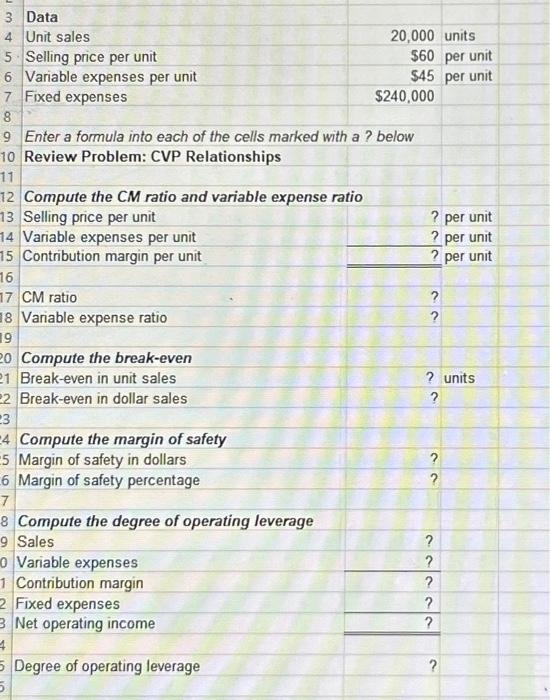
\begin{tabular}{|l|r|} \hline Data & \\ \hline Unit sales & 20,000 units \\ \hline Selling price per unit & $60 per unit \\ \hline Variable expenses per unit & $45 per unit \\ \hline Fixed expenses & $240,000 \\ \hline \end{tabular} Enter a formula into each of the cells marked with a ? below Review Problem: CVP Relationships Compute the CM ratio and variable expense ratio Selling price per unit ? per unit Variable expenses per unit ? per unit Contribution margin per unit ? per unit CM ratio Variable expense ratio ? Compute the break-even Break-even in unit sales ? units Break-even in dollar sales ? Compute the margin of safety Margin of safety in dollars Margin of safety percentage \begin{tabular}{c} ? per unit \\ ? per unit \\ \hline?? \\ ? \end{tabular} Compute the degree of operating leverage Sales Variable expenses Contribution margin Fixed expenses Net operating income \begin{tabular}{r} ? \\ ? \\ ?? \\ ?? \\ \hline? \\ \hline \end{tabular} Degree of operating leverage
Step by Step Solution
There are 3 Steps involved in it

Get step-by-step solutions from verified subject matter experts