

Question: Below are bivariate data giving birthrate and life expectancy information for each of twelve countries. For each of the countries, both the number of births

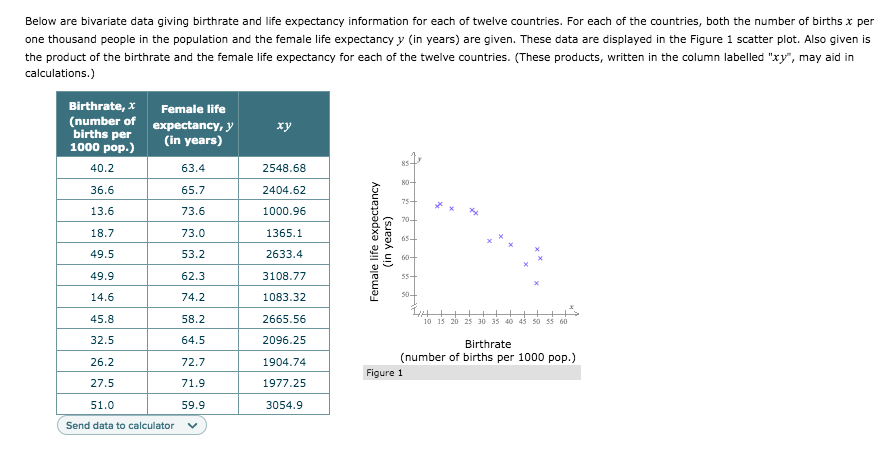

Below are bivariate data giving birthrate and life expectancy information for each of twelve countries. For each of the countries, both the number of births x per one thousand people in the population and the female life expectancy y (in years) are given. These data are displayed in the Figure 1 scatter plot. Also given is the product of the birthrate and the female life expectancy for each of the twelve countries. (These products, written in the column labelled "xy", may aid in calculations.) Birthrate, x Female life (number of births per expectancy, y xy 1000 pop.) (in years) 40.2 63.4 2548.68 80 36.6 65.7 2404.62 75- 13.6 73.6 1000.96 70- 18.7 73.0 1365.1 Female life expectancy (in years) 49.5 53.2 2633.4 60- 49.9 62.3 3108.77 14.6 74.2 1083.32 45.8 58.2 2665.56 10 15 20 25 30 35 40 43 50 35 60 32.5 64.5 2096.25 Birthrate 26.2 72.7 1904.74 (number of births per 1000 pop.) Figure 1 27.5 71.9 1977.25 51.0 59.9 3054.9 Send data to calculator vWhat is the sample correlation coefficient for these data? Carry your intermediate computations to at least four decimal places and round your answer to at least three decimal places. (If necessary, consult a list of formulas.) X 5
Step by Step Solution
There are 3 Steps involved in it

Get step-by-step solutions from verified subject matter experts