

Question: question 1 Might we be able to predict life expectancyrom birthrates? Below are bivariate data giving birthrate and life expectancy information for each of twelve


question 1
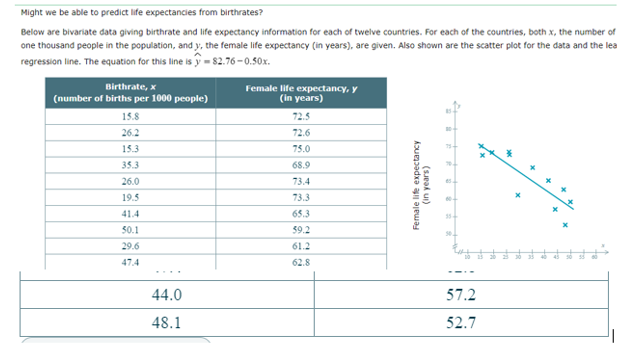
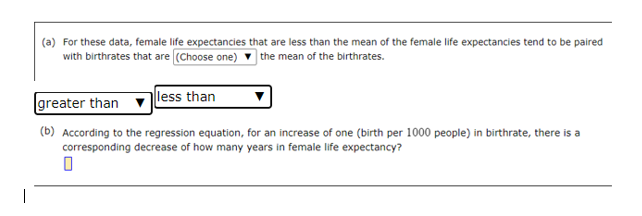
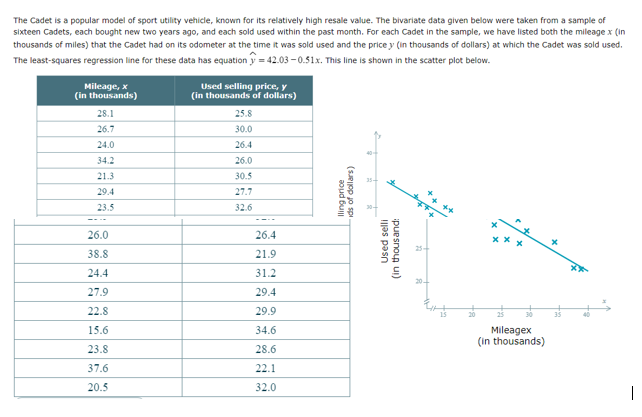
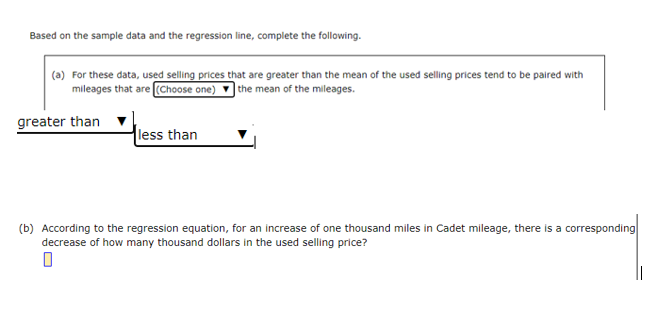
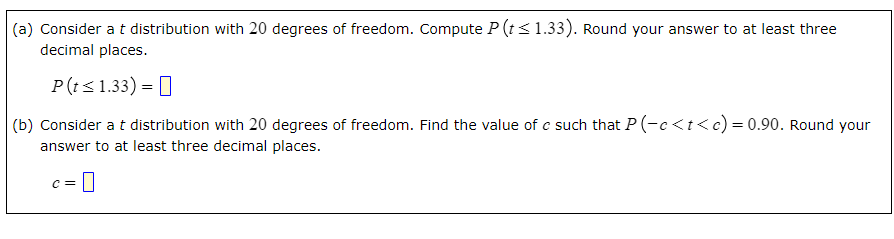
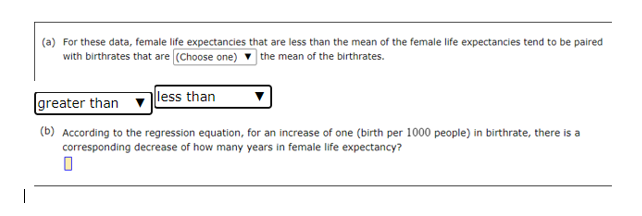
Might we be able to predict life expectancyrom birthrates? Below are bivariate data giving birthrate and life expectancy information for each of twelve countries. For each of the countries, both x, the number of one thousand people in the population, and y, the female life expectancy (in years), are given. Also shown are the scatter plot for the data and the lea regression line. The equation for this line is y = $2.76-0.50x. Birthrate, * Female life expectancy, y (number of births per 1000 people) (in years) 15.8 72.5 26.2 72.6 153 75.0 35.3 68.9 26.0 73.4 (in years) Female life expectancy 19.5 73.3 41.4 65.3 50.1 59.2 29.6 61.2 47.4 62.8 44.0 57.2 48.1 52.7(a) For these data, female life expectancyes that are less than the mean of the female life expectancyes tend to be paired with birthrates that are (Choose one) the mean of the birthrates. greater than less than (b) According to the regression equation, for an increase of one (birth per 1000 people) in birthrate, there is a corresponding decrease of how many years in female life expectancy?The Cadet is a popular model of sport utility vehicle, known for its relatively high resale value. The bivariate data given below were taken from a sample of sixteen Cadets, each bought new two years ago, and each sold used within the past month. For each Cadet in the sample, we have listed both the mileage x (in thousands of miles) that the Cadet had on its odometer at the time it was sold used and the pricey (in thousands of dollars) at which the Cadet was sold used. The least-squares regression line for these data has equation y = 42.03 -0.51x. This line is shown in the scatter plot below. Mileage, X Used selling price, y (in thousands) (in thousands of dollars) 28.1 25.8 26.7 30.0 24.0 26.4 34.2 26.0 21.3 30.5 29.4 27.7 "ids of dollars) Iling price 23.5 32.6 30- -- - 26.0 26.4 Used selli (in thousand: 38.8 21.9 24.4 31.2 27.9 29.4 22.8 29.9 15 25 35 15.6 34.6 Mileagex 23.8 28.6 (in thousands) 37.6 22.1 20.5 32.0 -Based on the sample data and the regression line, complete the following. (a) For these data, used selling prices that are greater than the mean of the used selling prices tend to be paired with mileages that are (Choose one) the mean of the mileages. greater than less than (b) According to the regression equation, for an increase of one thousand miles in Cadet mileage, there is a corresponding decrease of how many thousand dollars in the used selling price?(a) Consider a t distribution with 20 degrees of freedom. Compute P (I i: 1.33). Round your answer to at least three decimal places. Prs1.33)= I] (b) Consider a t distn'bution with 20 degrees of freedom. Find the value of r: such that P(c {I I
Step by Step Solution
There are 3 Steps involved in it

Get step-by-step solutions from verified subject matter experts