

Question: Below are four bivariate data sets and the scatter plot for each. (Note that each scatter plot is displayed on the same scale.) Each
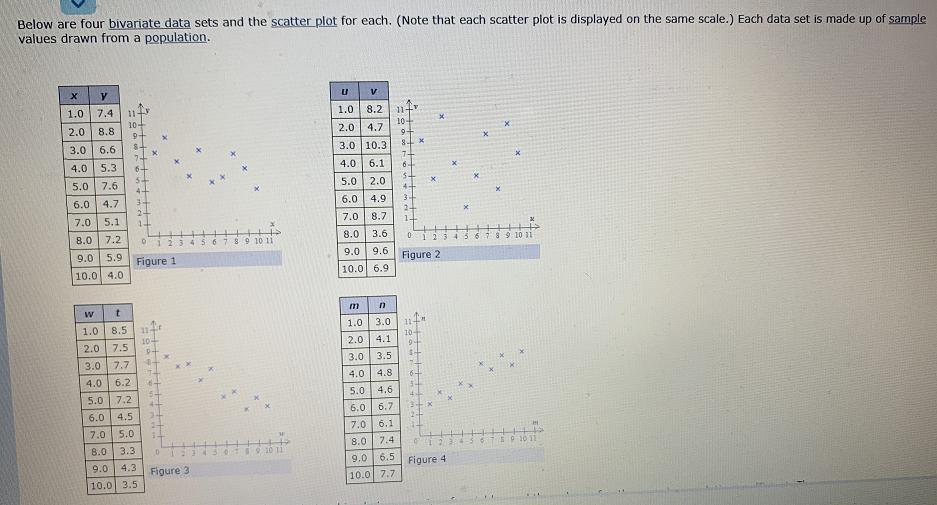
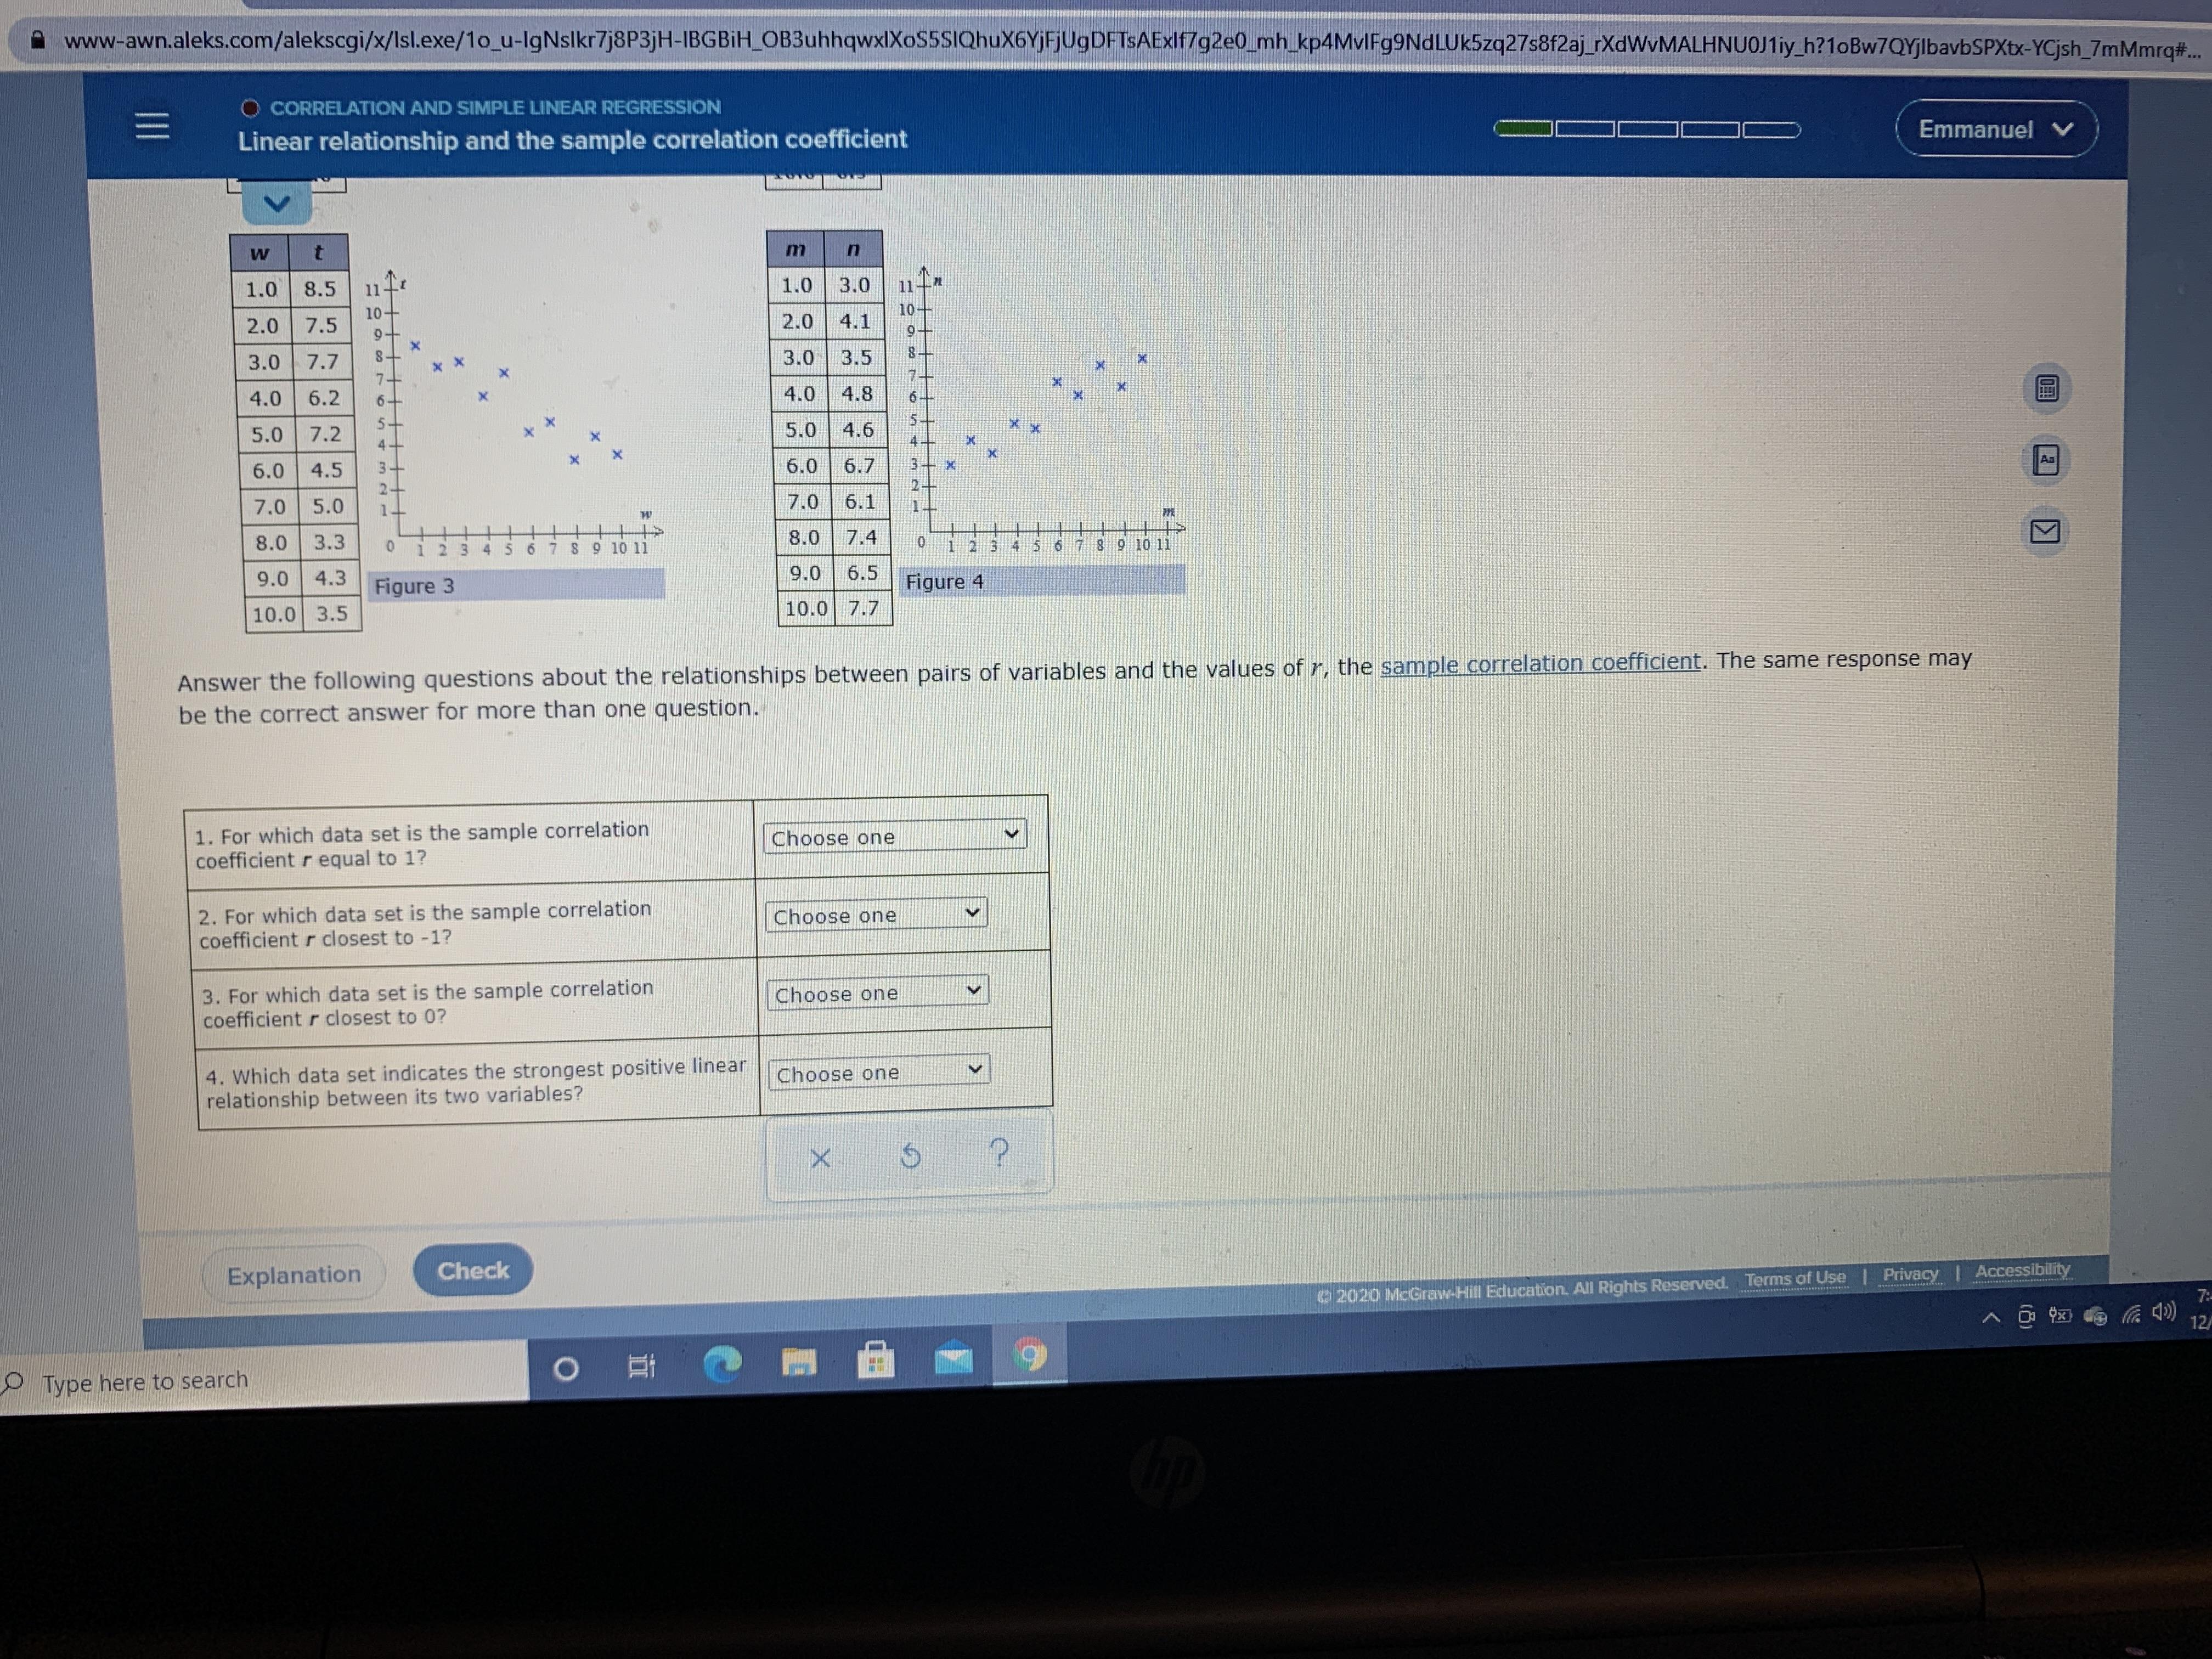
Below are four bivariate data sets and the scatter plot for each. (Note that each scatter plot is displayed on the same scale.) Each data set is made up of sample values drawn from a population. V 1.0 7.4 1.0 8.2 11fv 10+ 2.0 | 4.7 11- 10- 2.0 8.8 3.0 6.6 3.0 10.3 4.0 5.3 4.0 6.1 54 5.0 7.6 5.0 2.0 4+ 34 24 6.0 4.7 6.0 4.9 2- 8.7 1- 7.0 5.1 7.0 8.0 7.2 8.0 3.6 89 10 11 89 10 9.0 5.9 9.0 9.6 Figure 1 Figure 2 10.0 4.0 10.0 6.9 m 1.0 8.5 1.0 3.0 10- 20- 2.0 7.5 2.0 4.1 9- 3.0 7.7 3.0 3.5 4.0 6.2 4.0 4.8 6- 5.0 7.2 5.0 4.6 6.0 4.5 6.0 6.7 7.0 5.0 7.0 6.1 8.0 3.3 8.0 7.4 10 1 9.0 6.5 9.0 4.3 Figure 3 Figure 4 10.0 3.5 10.0 7.7 lol o | | | | olole lololO 1001 m45 6
Step by Step Solution
3.50 Rating (150 Votes )
There are 3 Steps involved in it

Get step-by-step solutions from verified subject matter experts