

Question: Below are several graphs labelled A through E, where all variables in these graphs are quantitative. And, beneath those graphs are statements with two blanks.A
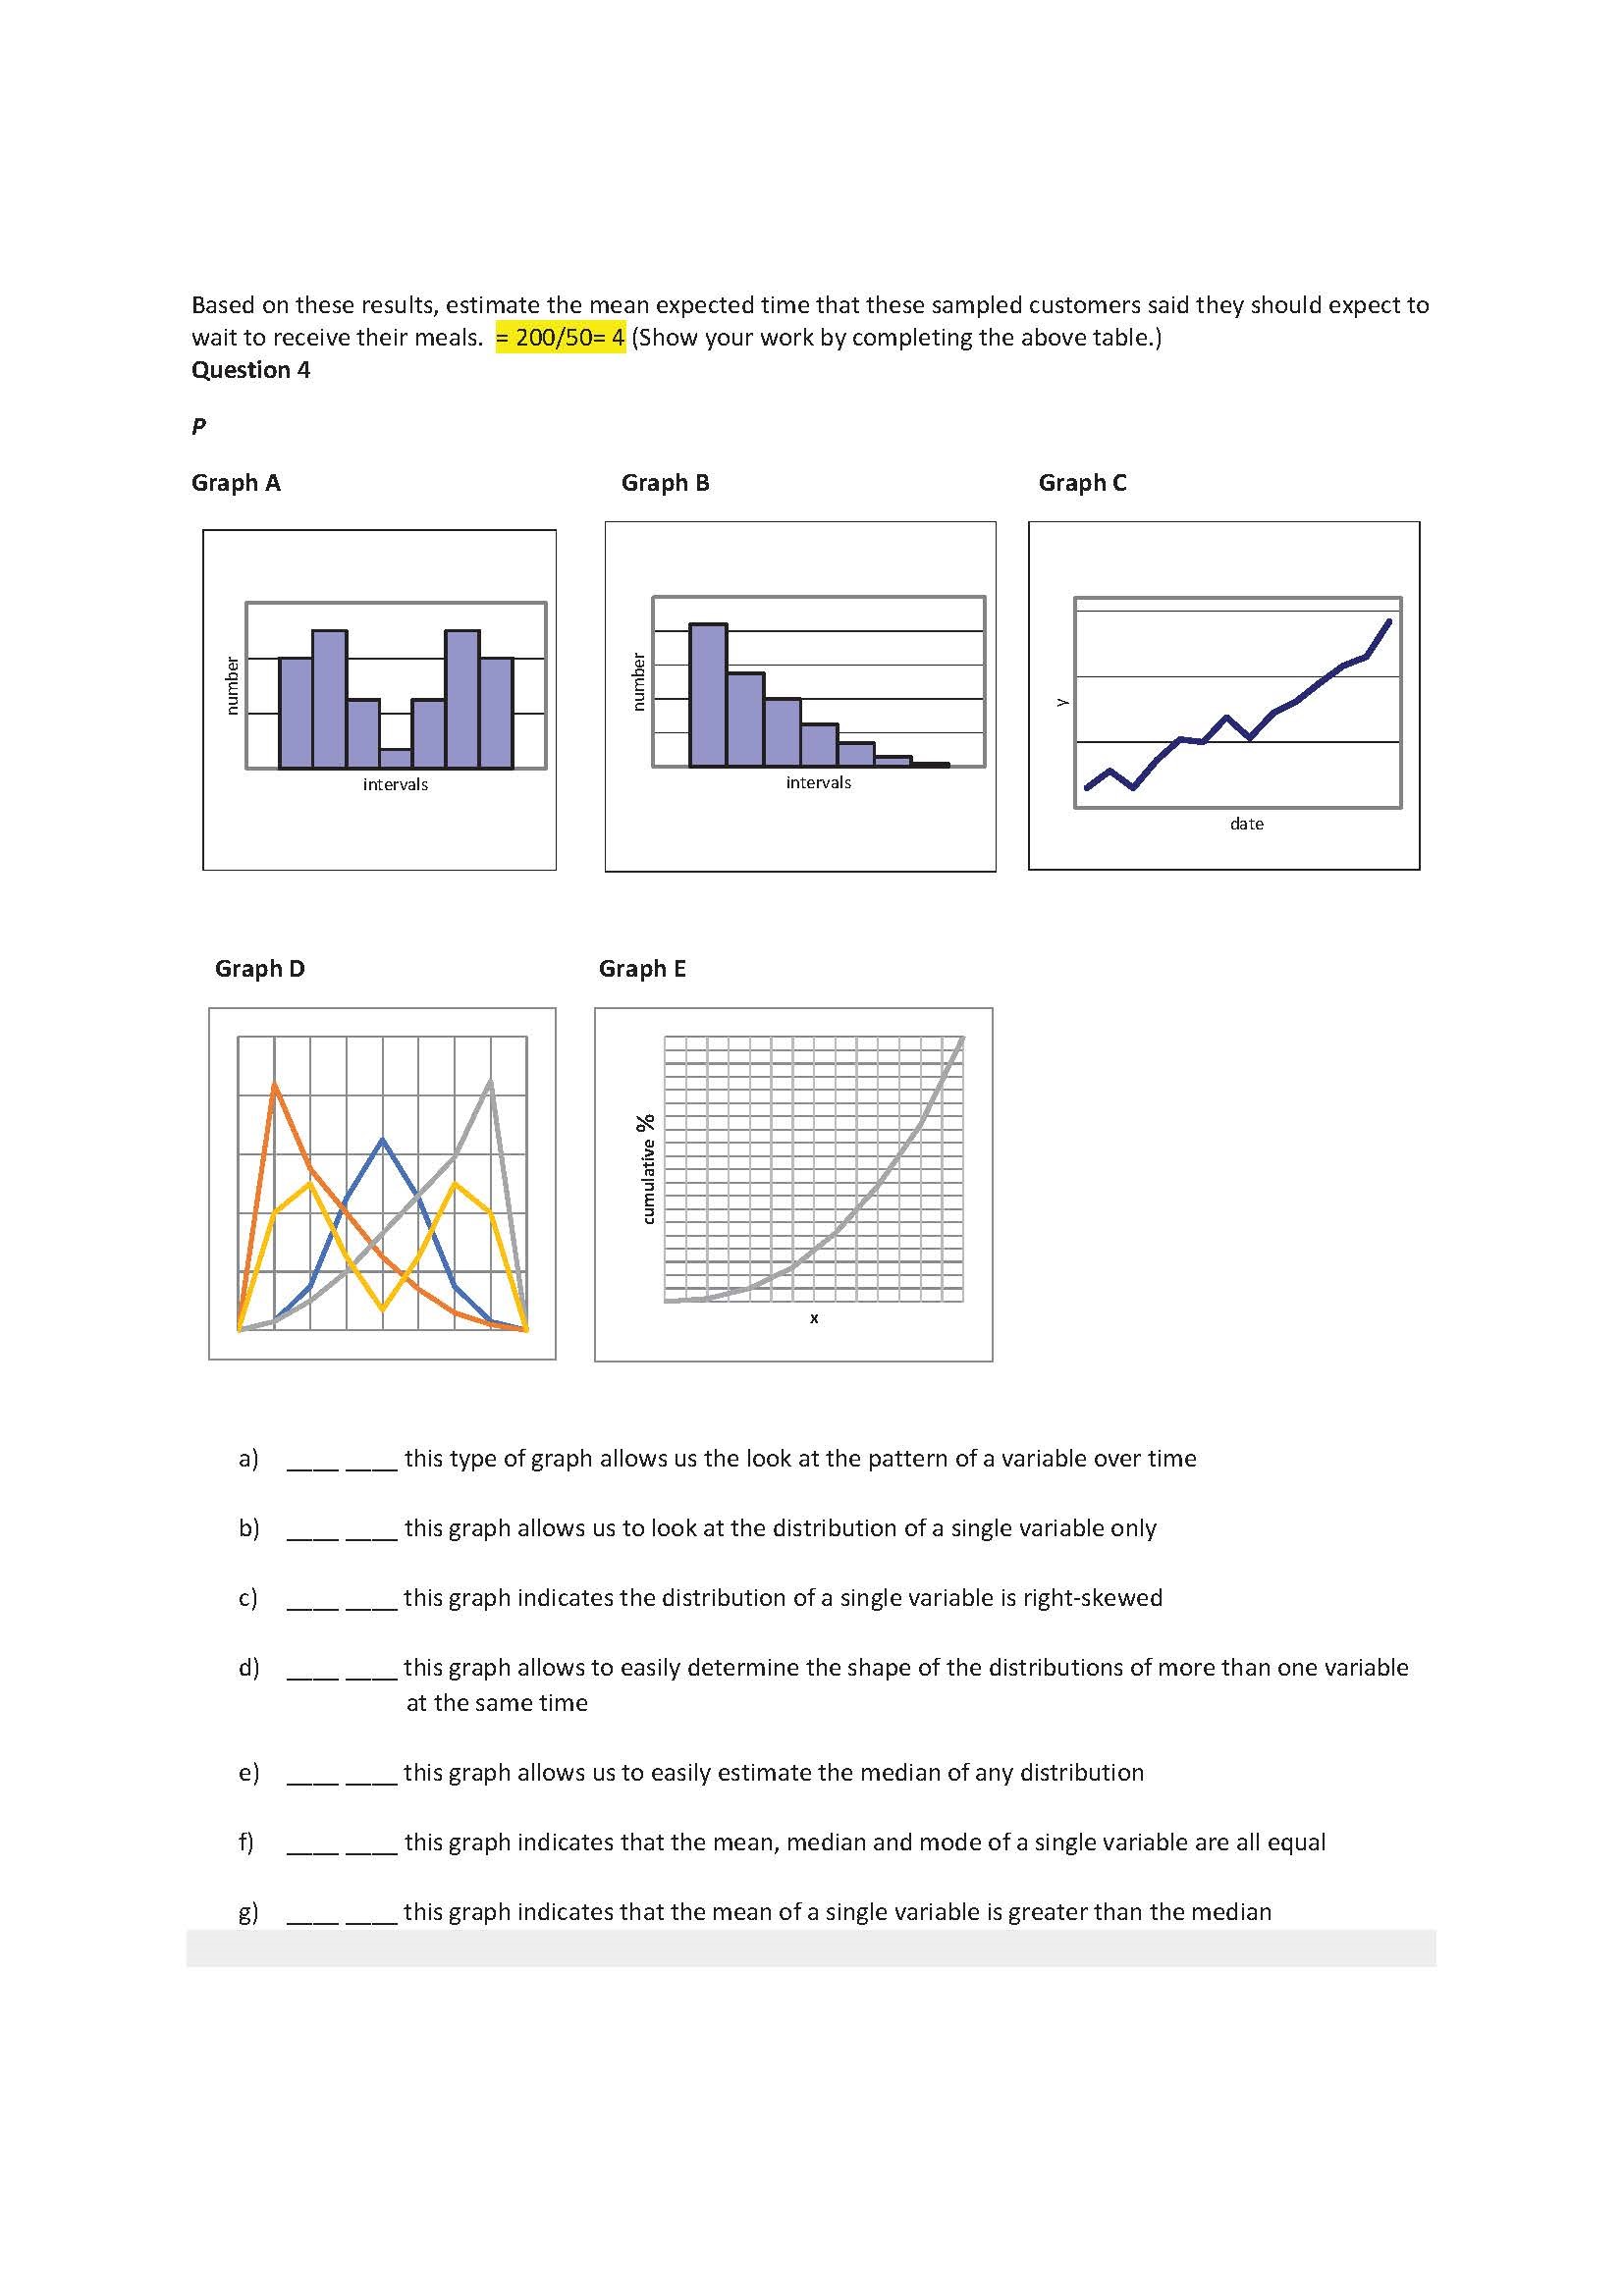
Below are several graphs labelled A through E, where all variables in these graphs are quantitative. And, beneath those graphs are statements with two blanks.A specific graph may be used to describe more than one statement..For each statement, fill in all the blanks with all the graph letters that apply to that statement (e.g., if only 1 graph applies to a particular statement, only fill in 1 of the blanks for that statement).
a)____ ____ this type of graph allows us the look at the pattern of a variable over time
b)____ ____ this graph allows us to look at the distribution of a single variable only
c)____ ____ this graph indicates the distribution of a single variable is right-skewed
d)____ ____ this graph allows to easily determine the shape of the distributions of more than one variable
at the same time
e)____ ____ this graph allows us to easily estimate the median of any distribution
f)____ ____ this graph indicates that the mean, median and mode of a single variable are all equal
g)____ ____ this graph indicates that the mean of a single variable is greater than the median
Based on these results, estimate the mean expected time that these sampled customers said they should expect to wait to receive their meals. = 200/50= 4 (Show your work by completing the above table.) Question 4 P Graph A Graph B Graph C number number intervals intervals date Graph D Graph E cumulative a) this type of graph allows us the look at the pattern of a variable over time b ) this graph allows us to look at the distribution of a single variable only c ) this graph indicates the distribution of a single variable is right-skewed d) this graph allows to easily determine the shape of the distributions of more than one variable at the same time e) this graph allows us to easily estimate the median of any distribution f) this graph indicates that the mean, median and mode of a single variable are all equal g) this graph indicates that the mean of a single variable is greater than the median
Step by Step Solution
There are 3 Steps involved in it

Get step-by-step solutions from verified subject matter experts