

Question: Below are the graphs of a position function, s(t), a velocity function, v(t), and an acceleration function, a(t), with respect to time, t.. 0.5
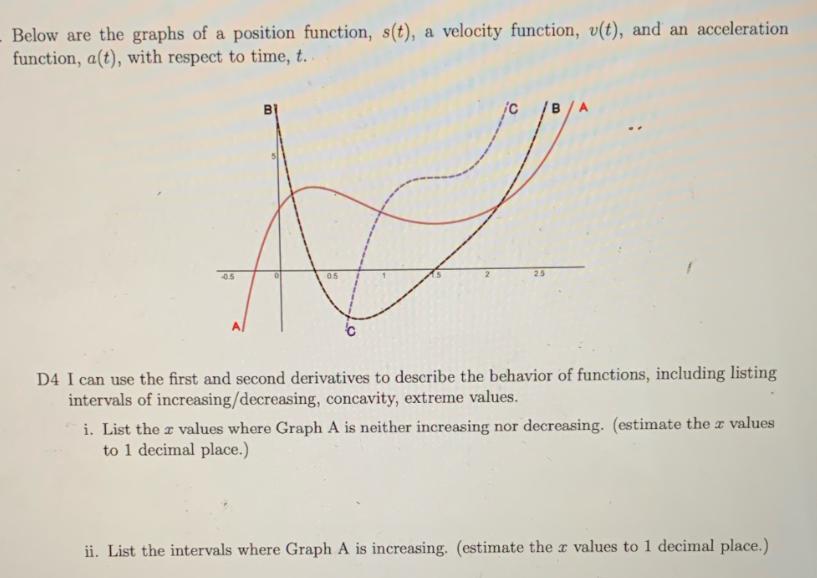
Below are the graphs of a position function, s(t), a velocity function, v(t), and an acceleration function, a(t), with respect to time, t.. 0.5 A 05 /B/A 25 D4 I can use the first and second derivatives to describe the behavior of functions, including listing intervals of increasing/decreasing, concavity, extreme values. i. List the values where Graph A is neither increasing nor decreasing. (estimate the values to 1 decimal place.) ii. List the intervals where Graph A is increasing. (estimate the r values to 1 decimal place.) iii. List the intervals where Graph A is decreasing. (estimate the r values to 1 decimal place.) iv. On which intervals would A's derivative be positive? v. Which graph has a second derivative that must be always positive? How do you know?
Step by Step Solution
There are 3 Steps involved in it

Get step-by-step solutions from verified subject matter experts