

Question: below are the questions, see pics 2. (16 points) Consider a data set on girls enrolled in the famous Berkeley Guidance Study; here we wish
below are the questions, see pics
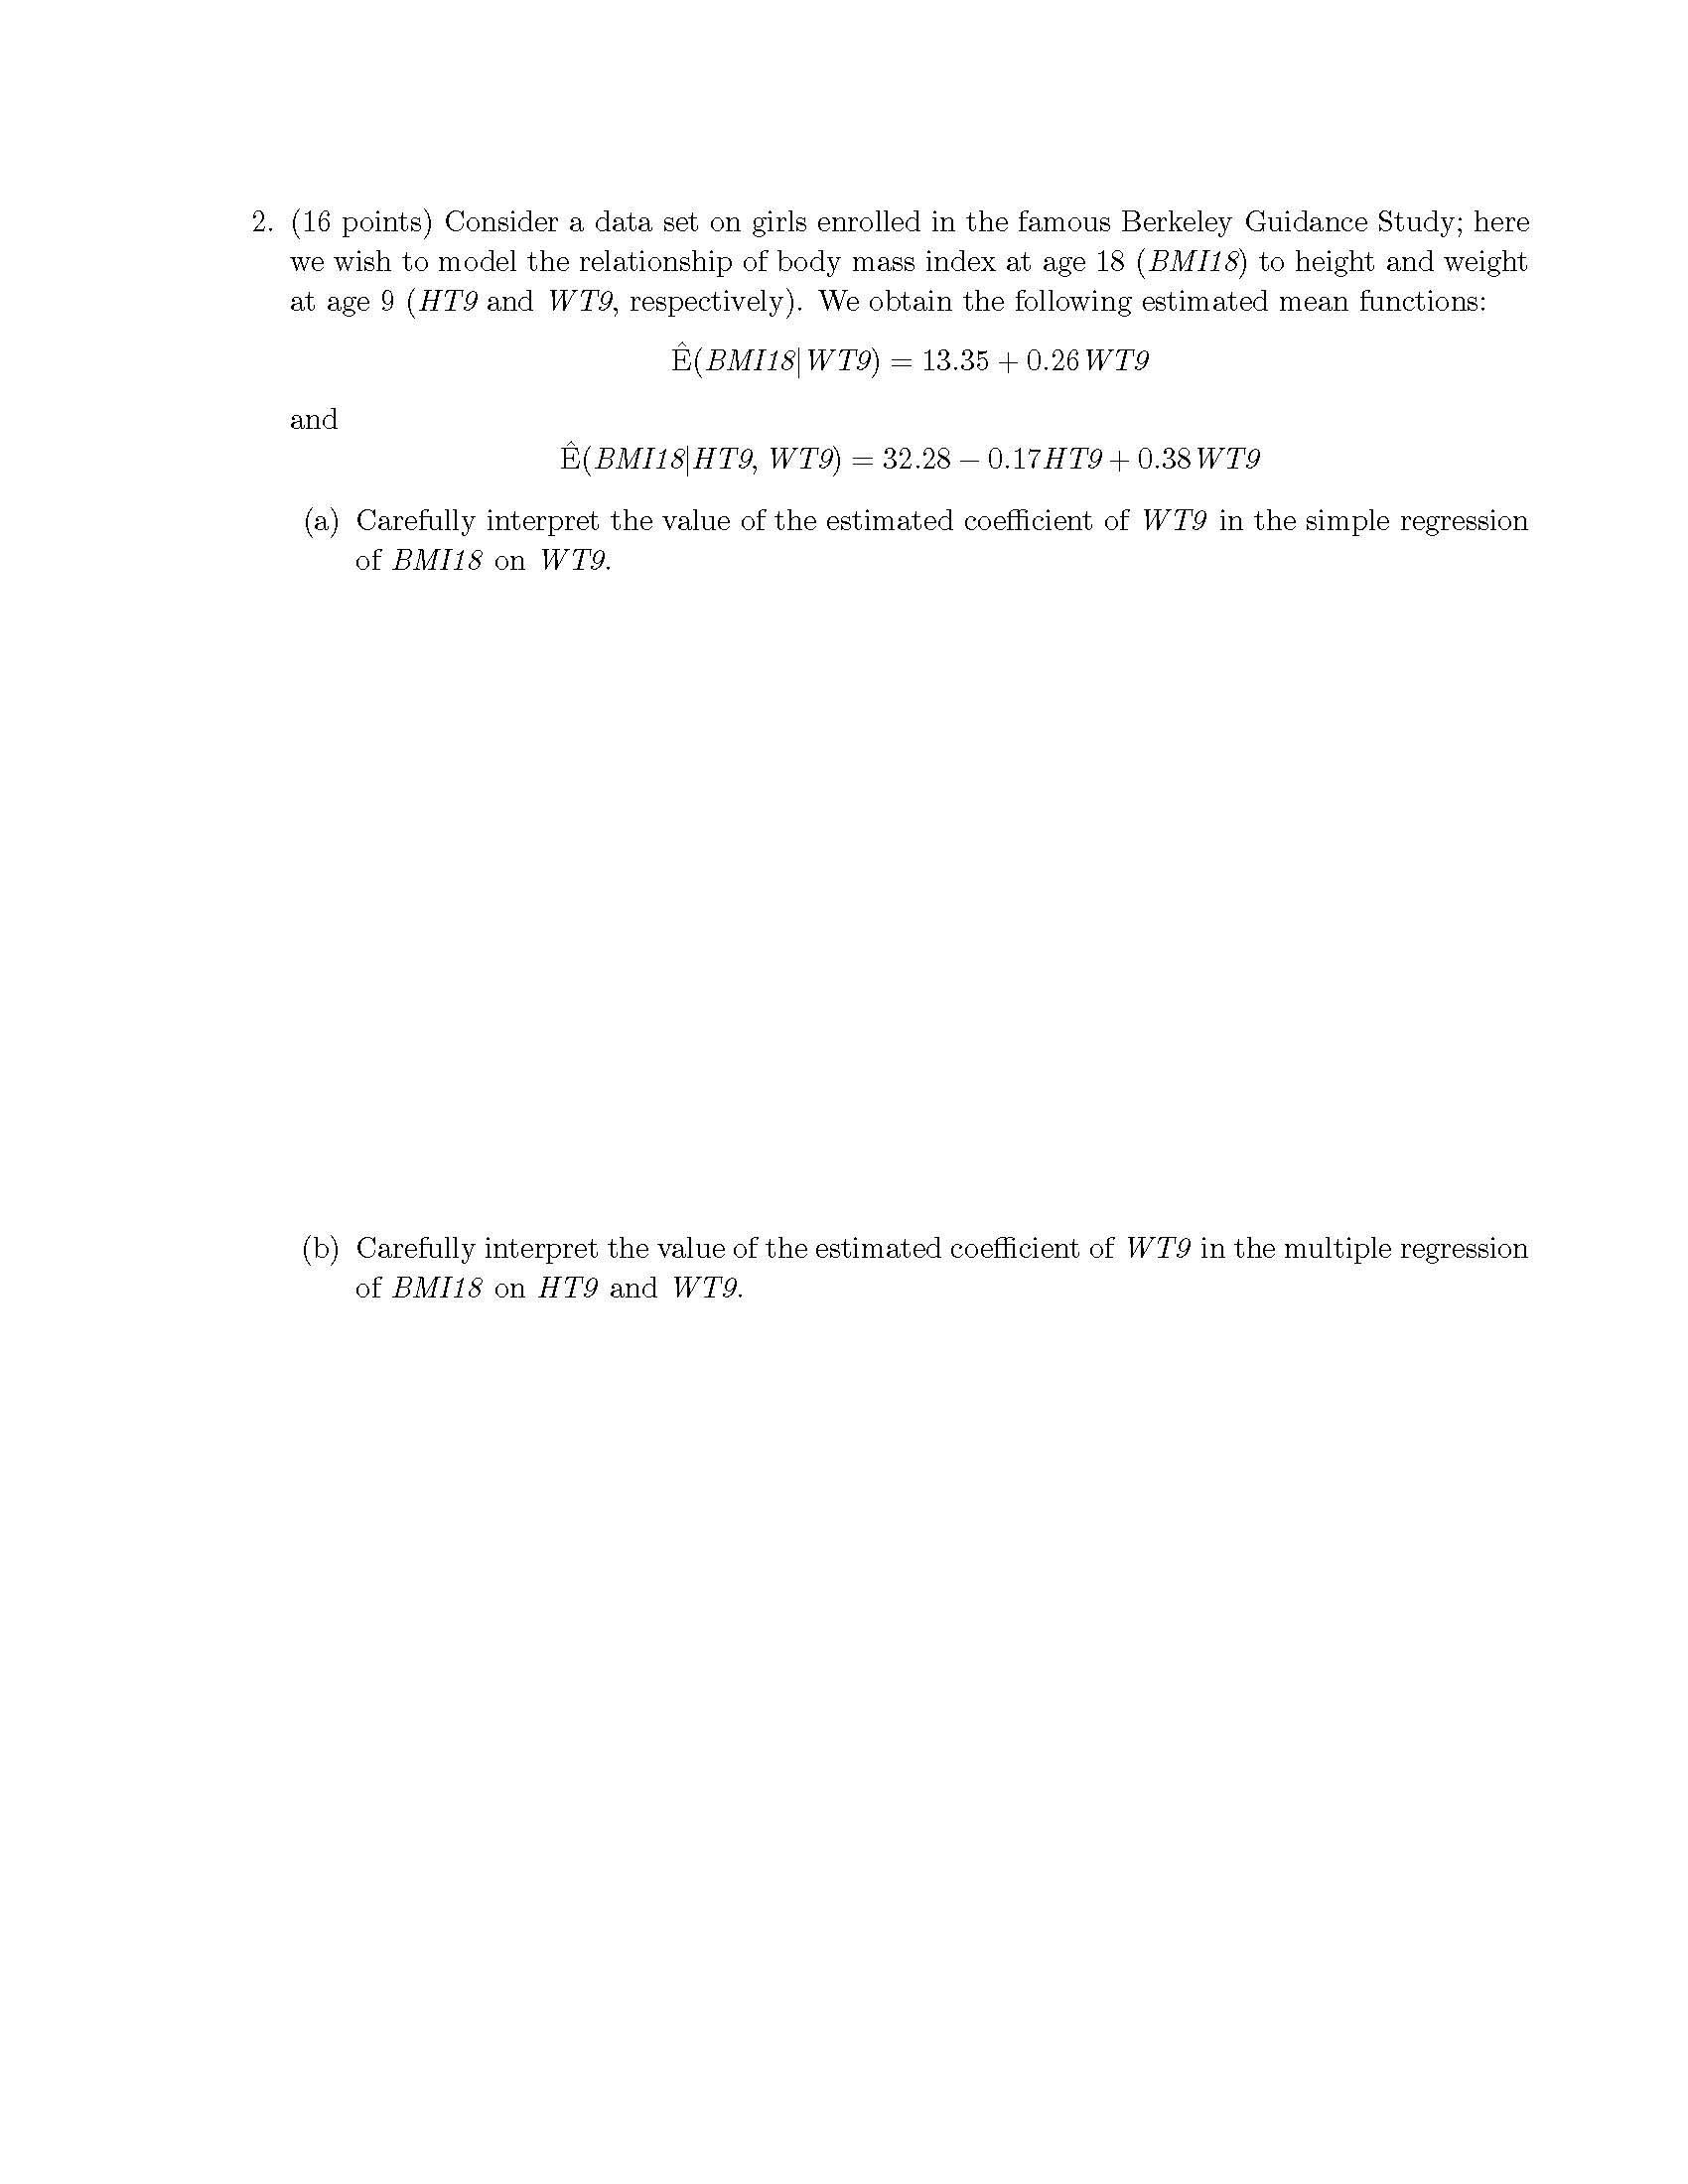
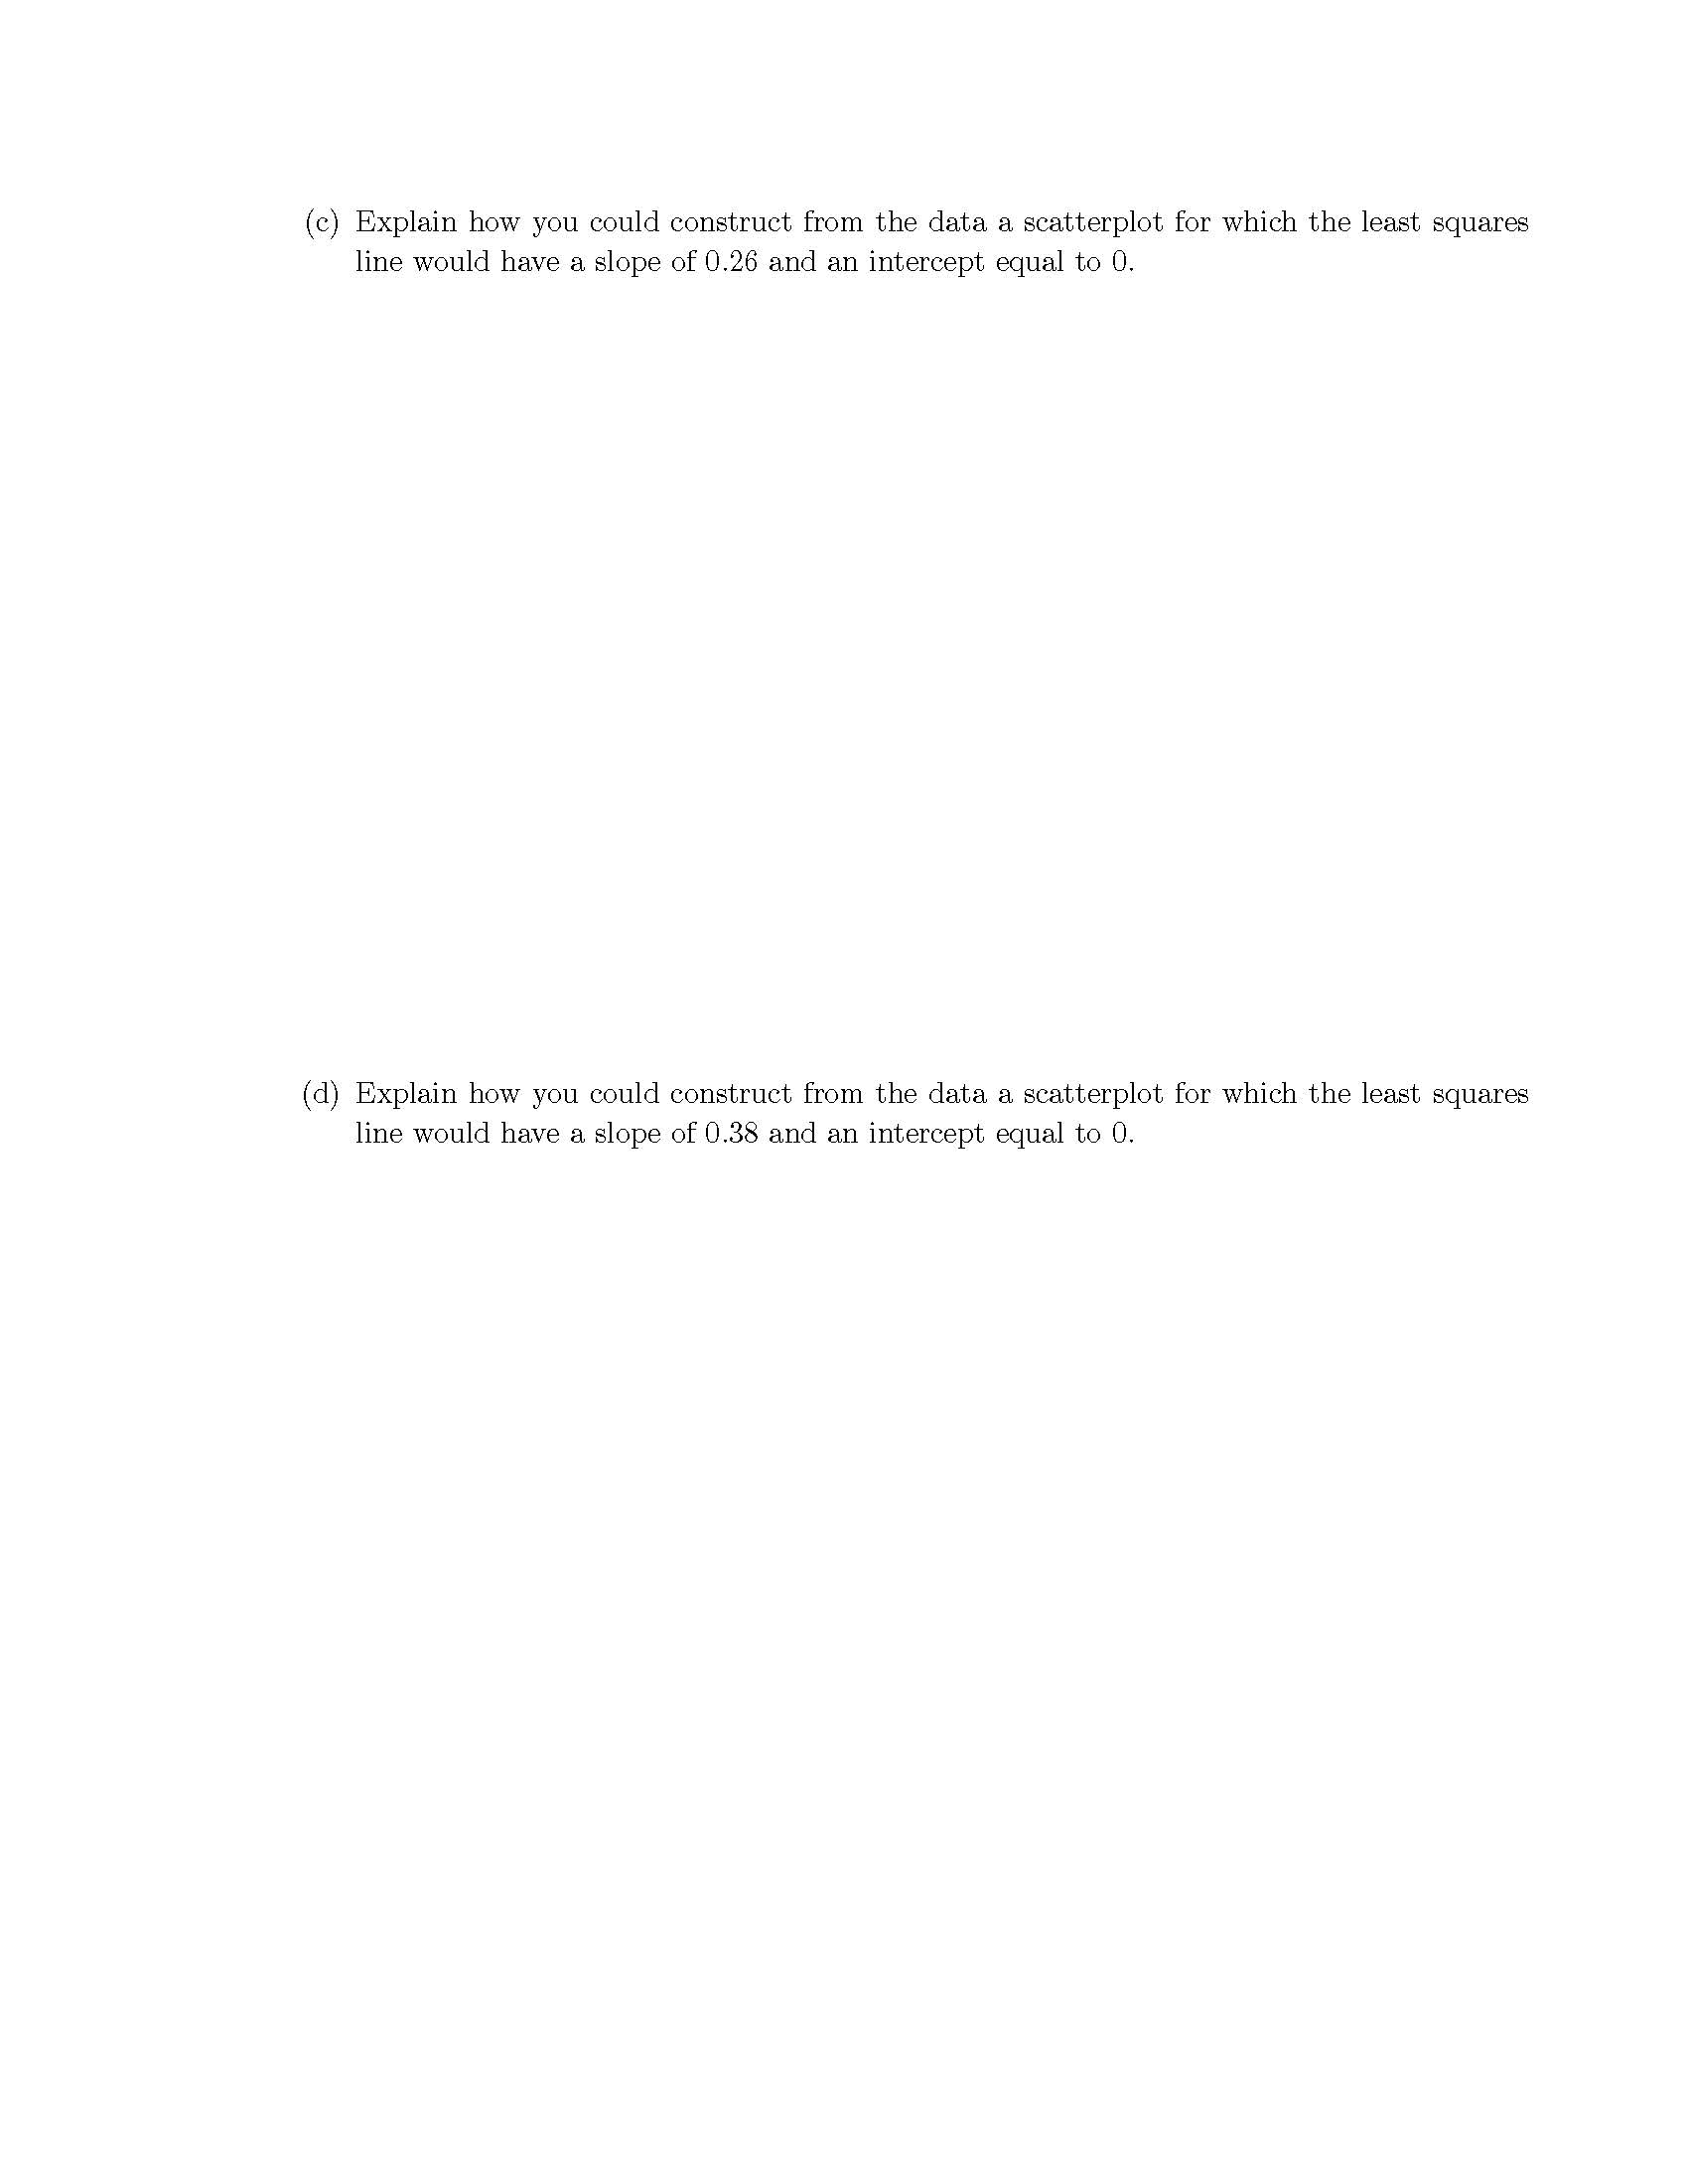
2. (16 points) Consider a data set on girls enrolled in the famous Berkeley Guidance Study; here we wish to model the relationship of body mass index at age 18 (BMI18) to height and weight at age 9 ( HT9 and WT9, respectively). We obtain the following estimated mean functions: E(BMI18 WT9) = 13.35 + 0.26 WT9 and E( BMI18 HT9, WT9) = 32.28 - 0.17HT9 + 0.38 WT9 (a) Carefully interpret the value of the estimated coefficient of WT9 in the simple regression of BMI18 on WT9. (b) Carefully interpret the value of the estimated coefficient of WT9 in the multiple regression of BMI18 on HT9 and WT9.(c) Explain how you could construct from the data a scatterplot for which the least squares line would have a slope of 0.26 and an intercept equal to O. (d) Explain how you could construct from the data a scatterplot for which the least squares line would have a slope of 0.38 and an intercept equal to O
Step by Step Solution
There are 3 Steps involved in it

Get step-by-step solutions from verified subject matter experts