

Question: BELOW ARE THE SAMPLE CHART: Compare & analyze the RETURN ON ASSET between two companies and provide explanation based on both Trend Analysis and Comparison
BELOW ARE THE SAMPLE CHART:
- Compare & analyze the RETURN ON ASSET between two companies and provide explanation based on both Trend Analysis and Comparison Analysis
a.) Use a horizontal (landscape) box format in Microsoft Word.
- Show all formula and calculations for the all financial ratios in each year.
- Show the graph of the trend of each ratio. (SAMPLE GRAPH AS PROVIDED)
- Write your analysis based on
- Trend Analysis [year by year performance for each company]; and
- Comparison Analysis [ year by year performance between the two companies).
Note: Must use adverbs or adjectives in your description analysis. Examples:
- The current ratio for 2019 is slightly lower than that of 2018 because
- In 2019, the current ratio for Maxis is significantly higher than
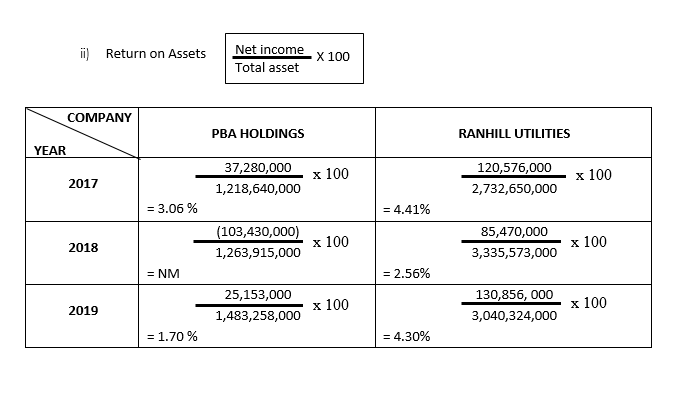
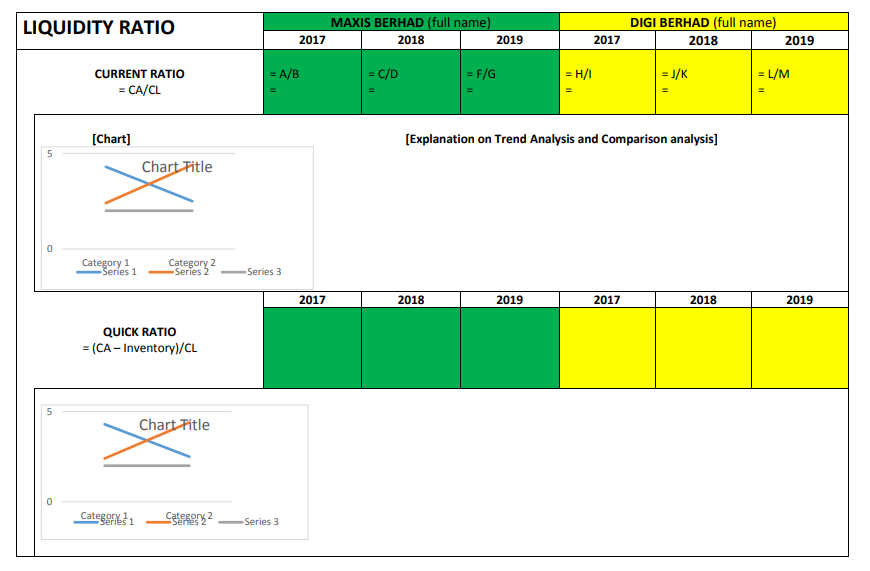
ii) Return on Assets Net income Total asset X 100 COMPANY PBA HOLDINGS RANHILL UTILITIES YEAR 37,280,000 1,218,640,000 x 100 2017 120,576,000 2,732,650,000 x 100 = 3.06% = 4.41% 2018 (103,430,000) 1,263,915,000 x 100 85,470,000 3,335,573,000 x 100 = NM = 2.56% 2019 25,153,000 1,483,258,000 x 100 130,856, 000 3,040,324,000 x 100 = 1.70 % = 4.30% LIQUIDITY RATIO MAXIS BERHAD (full name) 2017 2018 2019 DIGI BERHAD (full name) 2018 2019 2017 = A/B = C/D = F/G = H/1 = J/K = L/M CURRENT RATIO = CA/CL [Chart] [Explanation on Trend Analysis and Comparison analysis] 5 Chart Fitle 0 Category 1 Series 1 Category 2 Series 2 Series 3 2017 2018 2019 2017 2018 2019 QUICK RATIO = (CA - Inventory)/CL 5 Chart Fitle 0 Categorie 31 2 -Series 2 Series 3 ii) Return on Assets Net income Total asset X 100 COMPANY PBA HOLDINGS RANHILL UTILITIES YEAR 37,280,000 1,218,640,000 x 100 2017 120,576,000 2,732,650,000 x 100 = 3.06% = 4.41% 2018 (103,430,000) 1,263,915,000 x 100 85,470,000 3,335,573,000 x 100 = NM = 2.56% 2019 25,153,000 1,483,258,000 x 100 130,856, 000 3,040,324,000 x 100 = 1.70 % = 4.30% LIQUIDITY RATIO MAXIS BERHAD (full name) 2017 2018 2019 DIGI BERHAD (full name) 2018 2019 2017 = A/B = C/D = F/G = H/1 = J/K = L/M CURRENT RATIO = CA/CL [Chart] [Explanation on Trend Analysis and Comparison analysis] 5 Chart Fitle 0 Category 1 Series 1 Category 2 Series 2 Series 3 2017 2018 2019 2017 2018 2019 QUICK RATIO = (CA - Inventory)/CL 5 Chart Fitle 0 Categorie 31 2 -Series 2 Series 3
Step by Step Solution
There are 3 Steps involved in it

Get step-by-step solutions from verified subject matter experts