

Question: BELOW ARE SAMPLE CHART Compare & analyze the CURRENT RATIO AND QUICK RATIO between two companies and provide explanation based on both Trend Analysis and
BELOW ARE SAMPLE CHART
- Compare & analyze the CURRENT RATIO AND QUICK RATIO between two companies and provide explanation based on both Trend Analysis and Comparison Analysis
a.) Use a horizontal (landscape) box format in Microsoft Word.
- Show all formula and calculations for the all financial ratios in each year.
- Show the graph of the trend of each ratio. (SAMPLE GRAPH AS PROVIDED)
- Write your analysis based on
- Trend Analysis [year by year performance for each company]; and
- Comparison Analysis [ year by year performance between the two companies).
Note: Must use adverbs or adjectives in your description analysis. Examples:
- The current ratio for 2019 is slightly lower than that of 2018 because
- In 2019, the current ratio for Maxis is significantly higher than
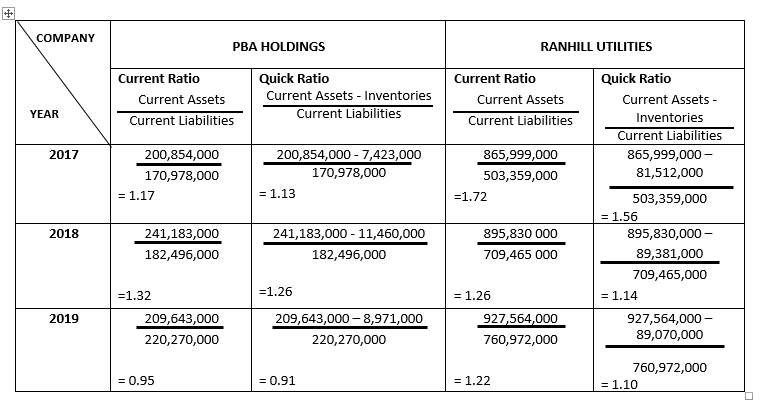
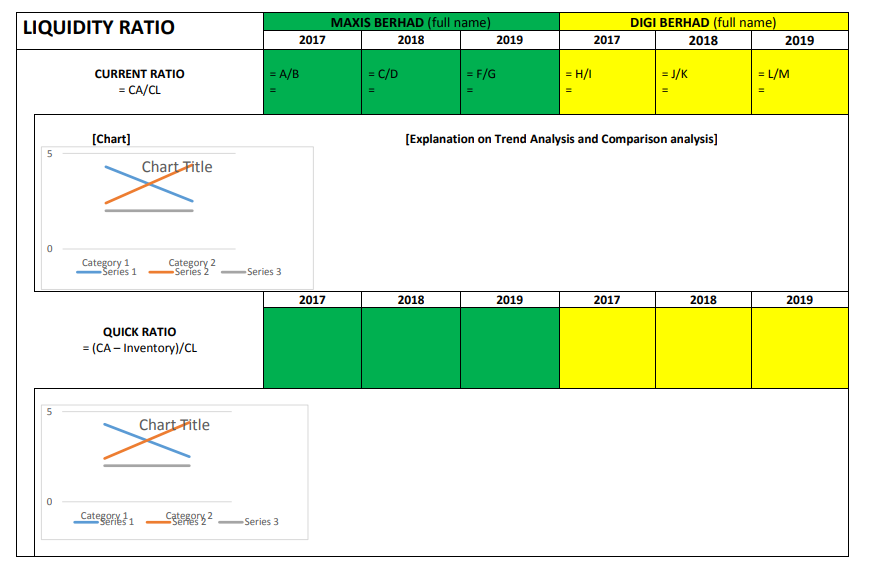
COMPANY PBA HOLDINGS RANHILL UTILITIES Current Ratio Current Assets Current Liabilities Quick Ratio Current Assets - Inventories Current Liabilities Current Ratio Current Assets Current Liabilities YEAR 2017 200,854,000 170,978,000 = 1.17 200,854,000 - 7,423,000 170,978,000 = 1.13 865,999,000 503,359,000 = 1.72 Quick Ratio Current Assets Inventories Current Liabilities 865,999,000 - 81,512,000 503,359,000 = 1.56 895,830,000 - 89,381,000 709,465,000 = 1.14 2018 241,183,000 182,496,000 241,183,000 - 11,460,000 182,496,000 895,830 000 709,465 000 =1.32 =1.26 2019 209,643,000 220,270,000 209,643,000 -8,971,000 220,270,000 = 1.26 927,564,000 760,972,000 927,564,000 - 89,070,000 = 0.95 = 0.91 = 1.22 760,972,000 = 1.10 LIQUIDITY RATIO MAXIS BERHAD (full name) 2017 2018 2019 DIGI BERHAD (full name) 2018 2019 2017 = A/B = C/D = F/G = H/1 = J/K = L/M CURRENT RATIO = CA/CL [Chart] [Explanation on Trend Analysis and Comparison analysis] 5 Chart Fitle 0 Category 1 Series 1 Category 2 Series 2 Series 3 2017 2018 2019 2017 2018 2019 QUICK RATIO = (CA - Inventory)/CL 5 Chart Fitle 0 Categorie 31 2 -Series 2 Series 3 COMPANY PBA HOLDINGS RANHILL UTILITIES Current Ratio Current Assets Current Liabilities Quick Ratio Current Assets - Inventories Current Liabilities Current Ratio Current Assets Current Liabilities YEAR 2017 200,854,000 170,978,000 = 1.17 200,854,000 - 7,423,000 170,978,000 = 1.13 865,999,000 503,359,000 = 1.72 Quick Ratio Current Assets Inventories Current Liabilities 865,999,000 - 81,512,000 503,359,000 = 1.56 895,830,000 - 89,381,000 709,465,000 = 1.14 2018 241,183,000 182,496,000 241,183,000 - 11,460,000 182,496,000 895,830 000 709,465 000 =1.32 =1.26 2019 209,643,000 220,270,000 209,643,000 -8,971,000 220,270,000 = 1.26 927,564,000 760,972,000 927,564,000 - 89,070,000 = 0.95 = 0.91 = 1.22 760,972,000 = 1.10 LIQUIDITY RATIO MAXIS BERHAD (full name) 2017 2018 2019 DIGI BERHAD (full name) 2018 2019 2017 = A/B = C/D = F/G = H/1 = J/K = L/M CURRENT RATIO = CA/CL [Chart] [Explanation on Trend Analysis and Comparison analysis] 5 Chart Fitle 0 Category 1 Series 1 Category 2 Series 2 Series 3 2017 2018 2019 2017 2018 2019 QUICK RATIO = (CA - Inventory)/CL 5 Chart Fitle 0 Categorie 31 2 -Series 2 Series 3
Step by Step Solution
There are 3 Steps involved in it

Get step-by-step solutions from verified subject matter experts