

Question: Below is a graph of a normal distribution with mean j- 2 and standard deviation O=4. The shaded region represents the probability of obtaining a
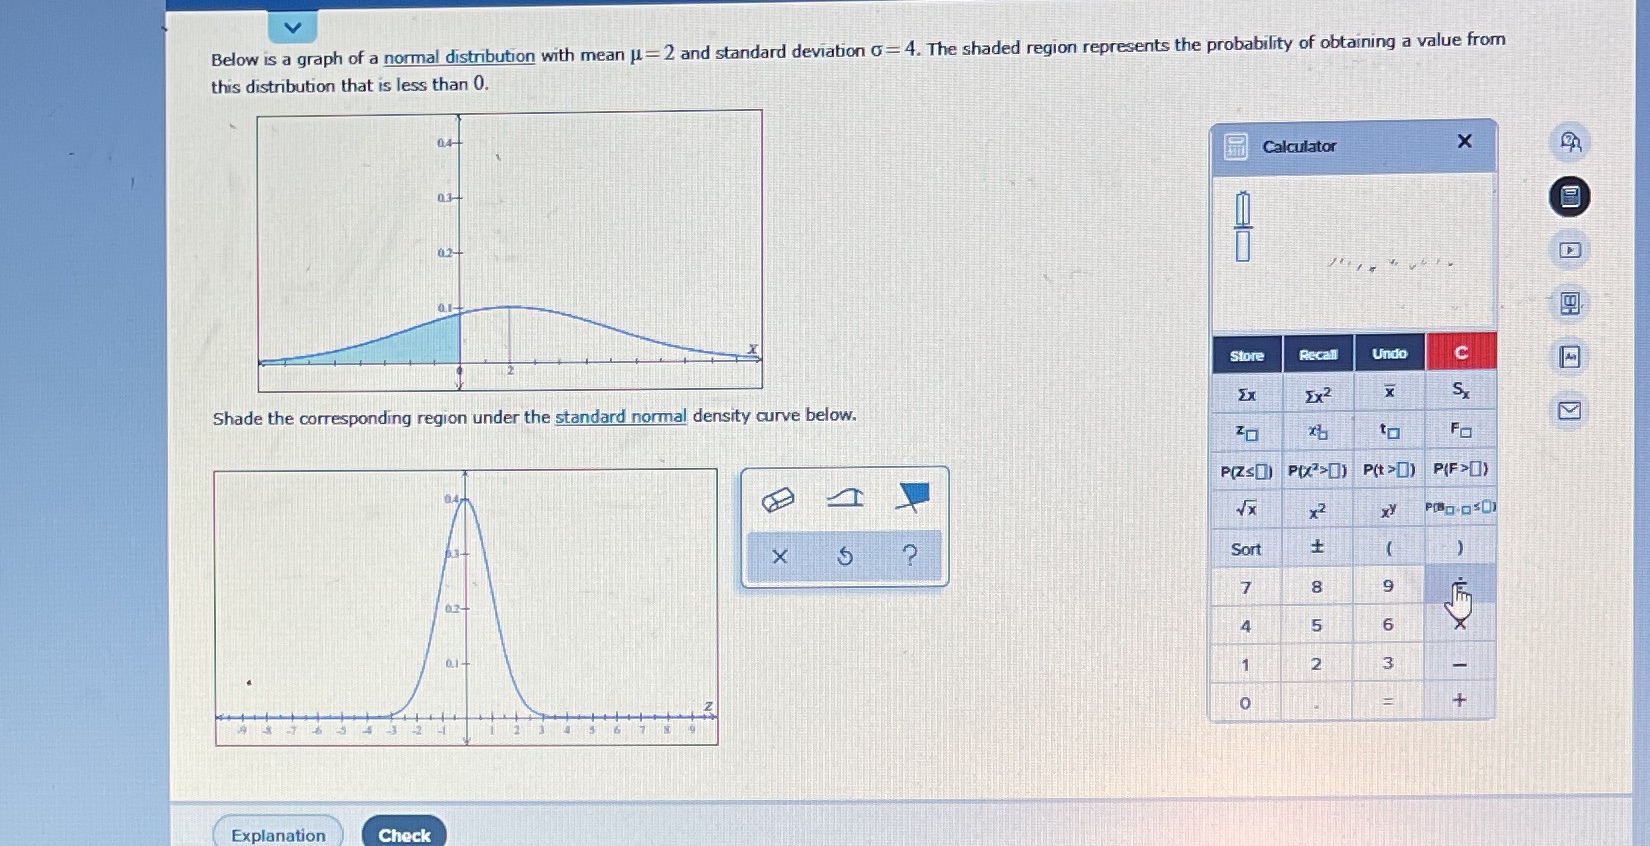

Below is a graph of a normal distribution with mean j- 2 and standard deviation O=4. The shaded region represents the probability of obtaining a value from this distribution that is less than 0. 04- Calculator X 03- Store Recall Undo C EX2 S Shade the corresponding region under the standard normal density curve below. P(ZS[) PIX >[) P(t >) P(F>[) VX X Sort 7 5 2 3 Explanation Check
Step by Step Solution
There are 3 Steps involved in it
1 Expert Approved Answer
Step: 1 Unlock

Question Has Been Solved by an Expert!
Get step-by-step solutions from verified subject matter experts
Step: 2 Unlock
Step: 3 Unlock