

Question: Below is a graph of the difference between a 1-year government bond yield and the annual inflation rate. measured real interest rate between 1980 and
Below is a graph of the difference between a 1-year government bond yield and the annual inflation rate. measured real interest rate between 1980 and 2020.
A. If we use this as representation of general real interest rates in the economy, what has been the general trend in real rates over the past 40 years?
B. If you are a saver, is this trend good or bad for you? If you are a borrower, is the trend good or bad?
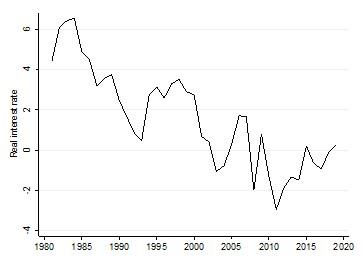
6 2 Real interest rate -2 ? 1980 1985 1990 1995 2000 2005 2010 2015 2020
Step by Step Solution
There are 3 Steps involved in it
1 Expert Approved Answer
Step: 1 Unlock

Question Has Been Solved by an Expert!
Get step-by-step solutions from verified subject matter experts
Step: 2 Unlock
Step: 3 Unlock