

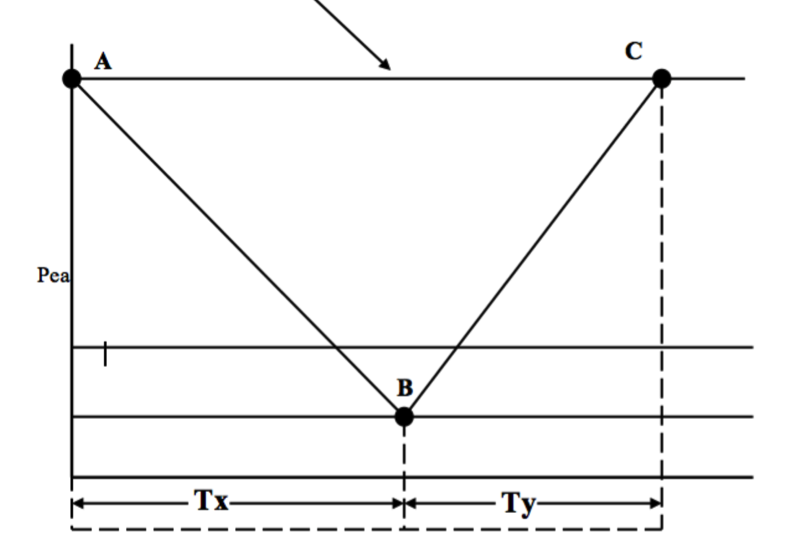
Question: Below is a graph showing the planned inventory cycle for Item #2092 kept in work-in-process.Using the graph and the information given below answer the following.
Below is a graph showing the planned inventory cycle for Item #2092 kept in work-in-process.Using the graph and the information given below answer the following.
Calculate the following:
a.Slopes of lines AB and BC
b.Safety Stock Quantity
c.Length of time indicated by Tx.
d.Length of time indicated by Ty.
Stable Demand = 210 units per day
Service Level = 99.6%
Per-order cost = $145
Carrying Cost = $9/unit/year
250 working days per year
Peak Inventory = 1608.098912
p = 600
\f
Step by Step Solution
There are 3 Steps involved in it
1 Expert Approved Answer
Step: 1 Unlock

Question Has Been Solved by an Expert!
Get step-by-step solutions from verified subject matter experts
Step: 2 Unlock
Step: 3 Unlock