

Question: Below is a graphic on the CPS85 data table from the package mosaicData . Complete the ggplot statements that will construct each graphic. clerical const
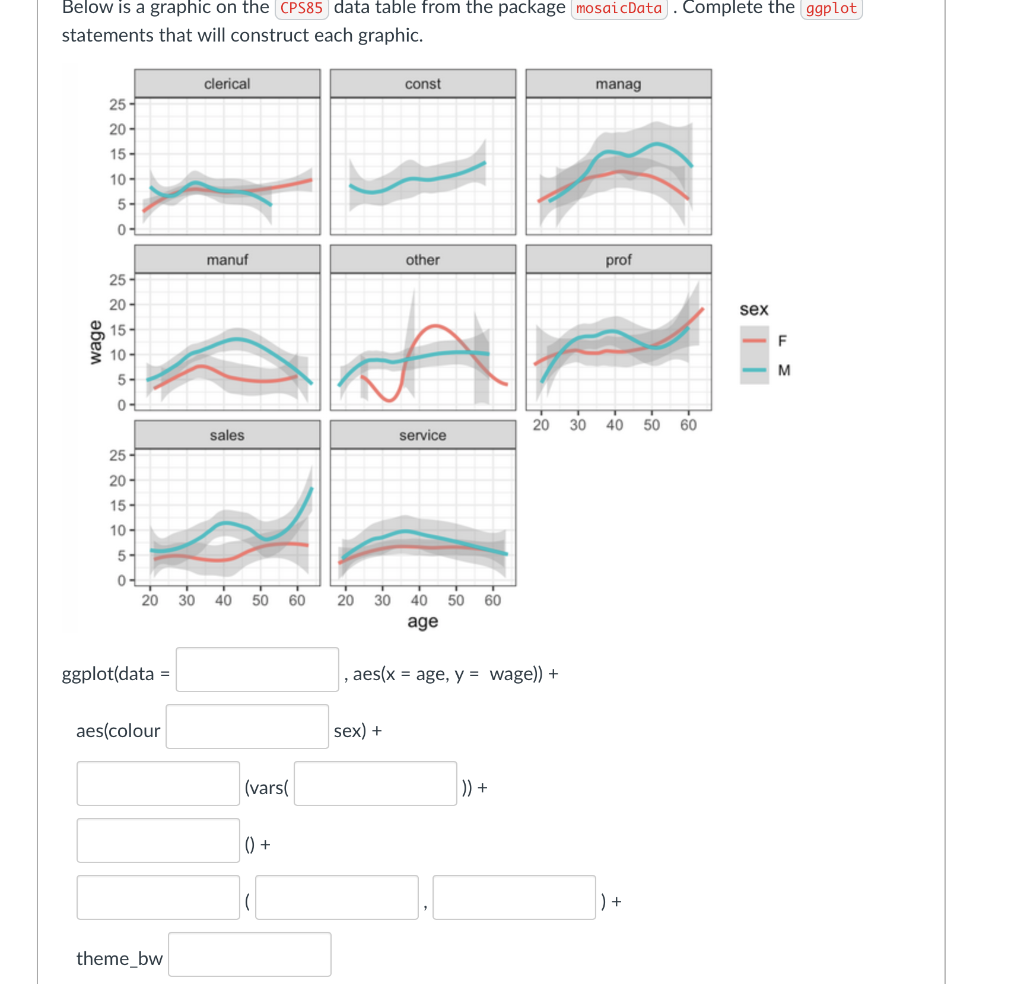
Below is a graphic on the CPS85 data table from the package mosaicData . Complete the ggplot statements that will construct each graphic. clerical const manag 25 20 - 15 10- 5 0- manuf other prof 25 20 sex wage 15 10- F M 5- 0- 20 30 40 50 60 sales service 25 20- 15 - 10- 5 0-2 20 30 40 50 60 20 30 60 40 50 age ggplot(data = aes(x = age, y = wage)) + aes(colour sex) + (vars( )) + 0 + ) + theme_bw
Step by Step Solution
There are 3 Steps involved in it
1 Expert Approved Answer
Step: 1 Unlock

Question Has Been Solved by an Expert!
Get step-by-step solutions from verified subject matter experts
Step: 2 Unlock
Step: 3 Unlock